Python에서 배우는 추론 통계 기초
Paul Savala
Assistant Professor of Mathematics
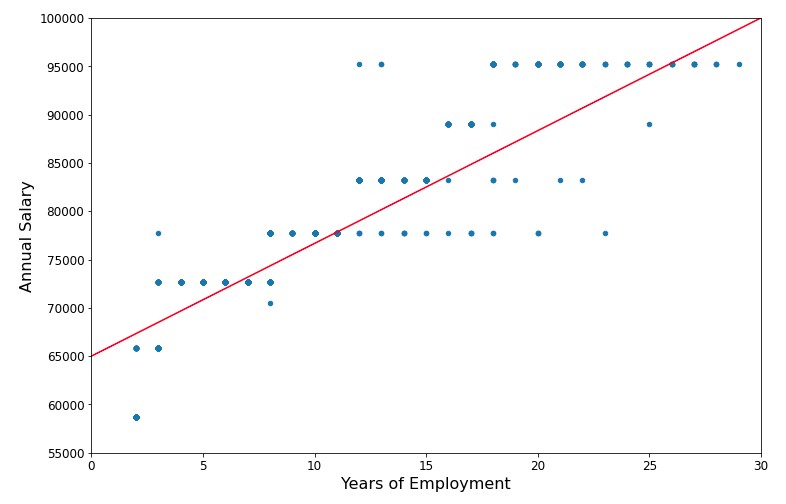
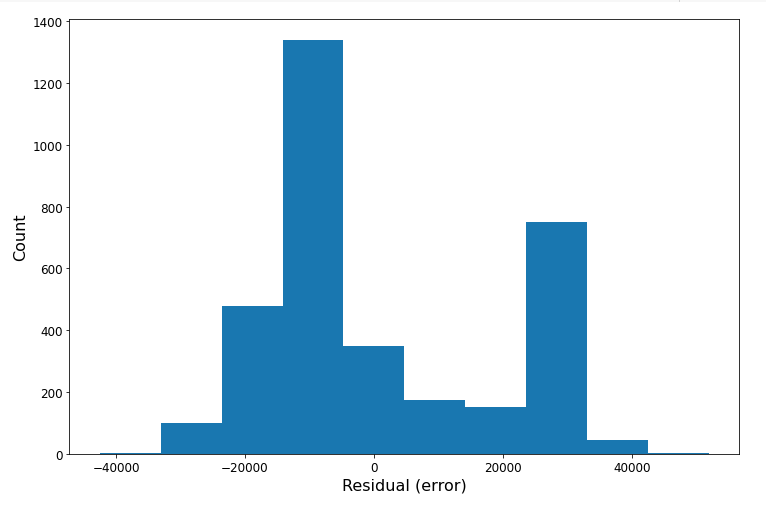
예측선 위·아래에 잔차가 균등하게 분포해야 함
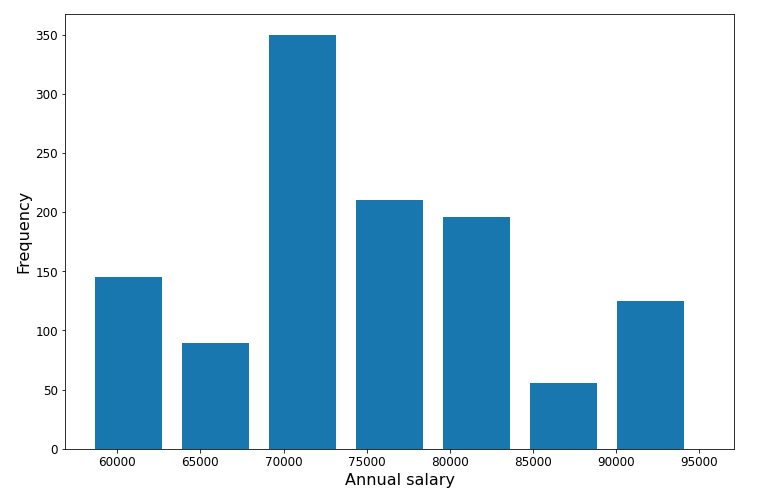
$H_0$: 데이터는 정규분포를 따름
$H_a$: 데이터는 정규분포를 따르지 않음
result = stats.anderson(police_df['Annual Salary'])

result.statistic
result = stats.anderson(police_df['Annual Salary'])
result.statistic
27.41
result.critical_values
[0.574, 0.654, 0.784, 0.915, 1.088]
result.significance_level[result.statistic > result.critical_values]
[15. 10. 5. 2.5 1. ]
mu, std = stats.norm.fit(police_df['Annual Salary'])


estimated_pct_under_70k = stats.norm.cdf(70000, loc=mu, scale=std)


print(estimated_pct_under_70k)
mu, std = stats.norm.fit(police_df['Annual Salary'])
estimated_pct_under_70k = stats.norm.cdf(70000, loc=mu, scale=std)
print(estimated_pct_under_70k)
0.27
actual_under_70k = police_df[police_df['Annual Salary'] < 70000]

print(len(actual_under_70k) / len(police_df))
actual_under_70k = police_df[police_df['Annual Salary'] < 70000]
print(len(actual_under_70k) / len(police_df))
0.20