Python에서 배우는 추론 통계 기초
Paul Savala
Assistant Professor of Mathematics


$n_1 = \text{그룹 1의 표본 크기}$
$n_2 = \text{그룹 2의 표본 크기}$
$s_1 = \text{그룹 1의 표준편차}$
$s_2 = \text{그룹 2의 표준편차}$
$\overline{x}_1 = \text{그룹 1의 평균}$
$\overline{x}_2 = \text{그룹 2의 평균}$
$s = \displaystyle\sqrt{\frac{(n_1-1)s_1^2 + (n_2-1)s_2^2}{n_1 + n_2 - 2}}$
Cohen의 $d = \displaystyle\frac{\overline{x}_1 - \overline{x}_2}{s}$
Cohen의 $d = 0.6$
중간~큰 효과 크기
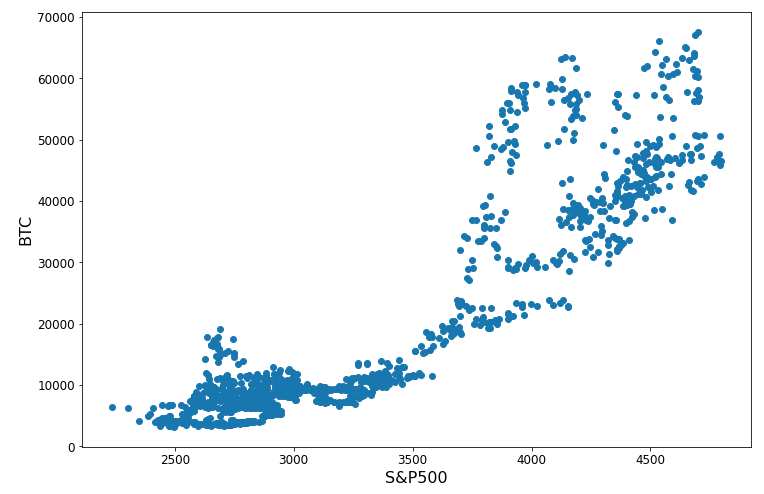
r, p_value = stats.pearsonr( btc_sp_df['Close_BTC'], btc_sp_df['Close_SP500'] )print(r**2)
0.82
$R^2:$ 한 변수를 알 때 다른 변수의 변동 설명 비율

Cramer의 $V = \displaystyle\sqrt{\frac{\chi^2/n}{d}}$
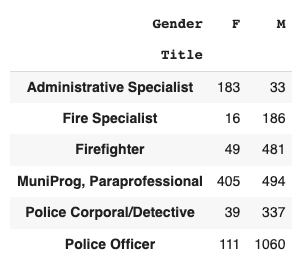
chi2, p, d, e = stats.chi2_contingency( contingency_table)dof = min(6-1, 2-1) = 1 n = 3394v = np.sqrt((chi2 / n) / dof)
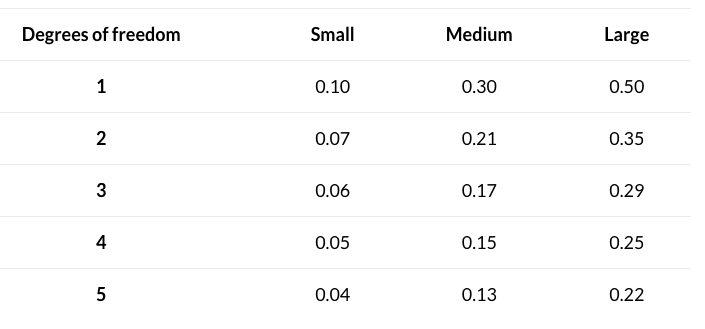
v = 0.52

Cramer's V = 0.52, Degrees of Freedom = 1
Python에서 배우는 추론 통계 기초