시간대가 체포율에 영향을 미치는가?

pandas로 경찰 활동 분석하기

Kevin Markham

Founder, Data School

datetime 데이터 분석

apple
    price    volume       date_and_time
0  174.35  20567800 2018-01-08 16:00:00
1  174.33  21584000 2018-01-09 16:00:00
2  155.15  54390500 2018-02-08 16:00:00
3  156.41  70672600 2018-02-09 16:00:00
4  176.94  23774100 2018-03-08 16:00:00
5  179.98  32185200 2018-03-09 16:00:00
pandas로 경찰 활동 분석하기

datetime 속성 접근 (1)

apple.dtypes
price                   float64
volume                    int64
date_and_time    datetime64[ns]
apple.date_and_time.dt.month
0    1
1    1
2    2
3    2
...
pandas로 경찰 활동 분석하기

datetime 속성 접근 (2)

apple.set_index('date_and_time', inplace=True)

apple.index
DatetimeIndex(['2018-01-08 16:00:00', '2018-01-09 16:00:00',
               '2018-02-08 16:00:00', '2018-02-09 16:00:00',
               '2018-03-08 16:00:00', '2018-03-09 16:00:00'],
              dtype='datetime64[ns]', name='date_and_time', freq=None)
apple.index.month
Int64Index([1, 1, 2, 2, 3, 3], dtype='int64', name='date_and_time')
  • DatetimeIndex에서는 dt 접근자를 사용하지 않음
pandas로 경찰 활동 분석하기

월별 평균 주가 계산

apple.price.mean()
169.52666666666667
apple.groupby(apple.index.month).price.mean()
date_and_time
1    174.34
2    155.78
3    178.46
Name: price, dtype: float64
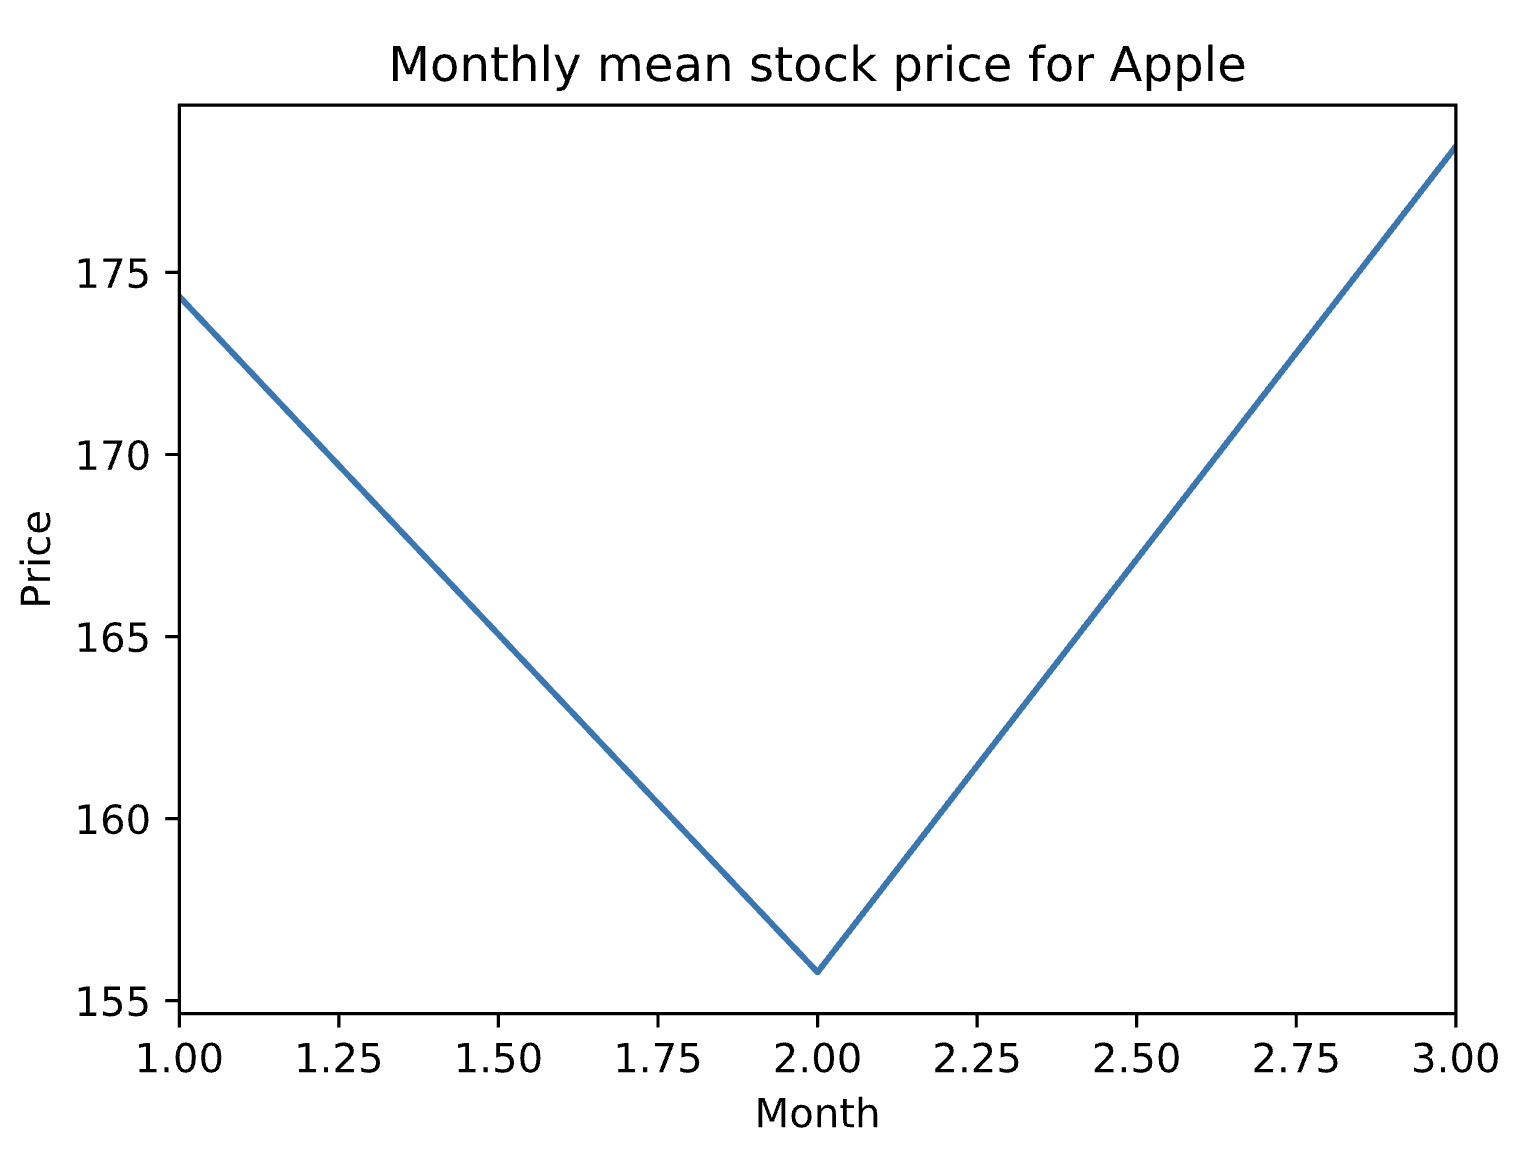
monthly_price = apple.groupby(apple.index.month).price.mean()
pandas로 경찰 활동 분석하기

월별 평균 주가 시각화

import matplotlib.pyplot as plt
monthly_price.plot()
  • 꺾은선 그래프: x축은 Series 인덱스, y축은 Series 값
plt.xlabel('Month')
plt.ylabel('Price')
plt.title('Monthly mean stock price for Apple')
plt.show()
pandas로 경찰 활동 분석하기

Apple 월별 평균 주가 꺾은선 그래프

pandas로 경찰 활동 분석하기

연습해 봅시다!

pandas로 경찰 활동 분석하기

Preparing Video For Download...