Matplotlib
R 사용자용 Python

Daniel Chen
Instructor
Matplotlib 그래프
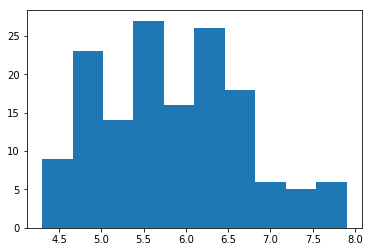
import matplotlib.pyplot as plt
plt.hist(iris['sepal_length'])
plt.show()
Matplotlib 산점도
plt.scatter(iris['sepal_length'], iris['sepal_width'])
plt.show()
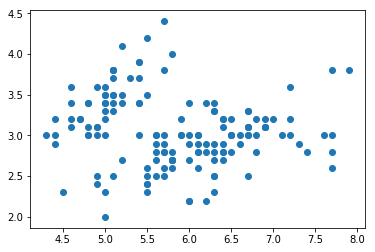
그림 다듬기
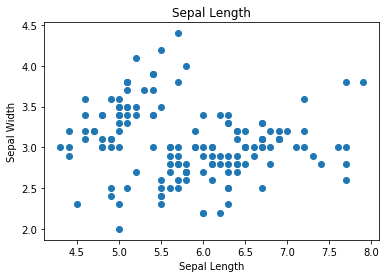
fig, ax = plt.subplots()
ax.scatter(iris['sepal_length'], iris['sepal_width'])
ax.set_title('Sepal Length')
ax.set_xlabel('Sepal Length')
ax.set_ylabel('Sepal Width')
plt.show()
축 눈금 회전
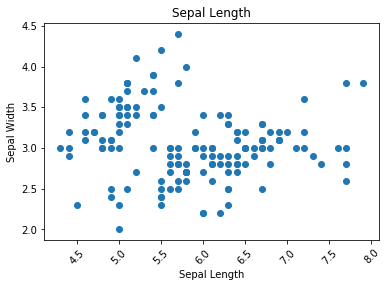
fig, ax = plt.subplots()
ax.scatter(iris['sepal_length'], iris['sepal_width'])
ax.set_title('Sepal Length')
ax.set_xlabel('Sepal Length')
ax.set_ylabel('Sepal Width')
plt.xticks(rotation=45) # rotate the x-axis ticks
plt.show()
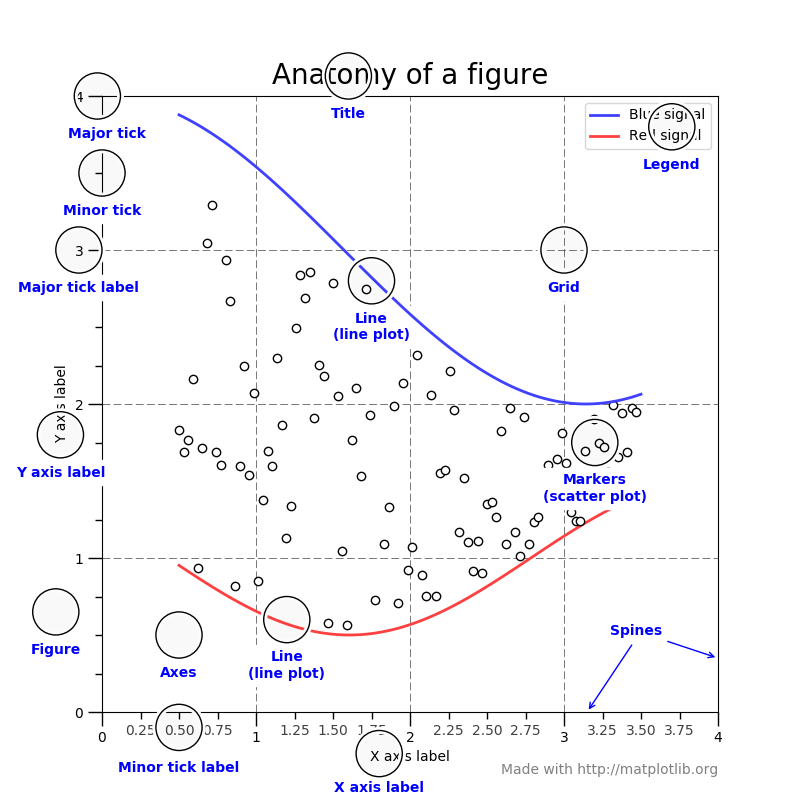
matplotlib 그림의 구성 요소
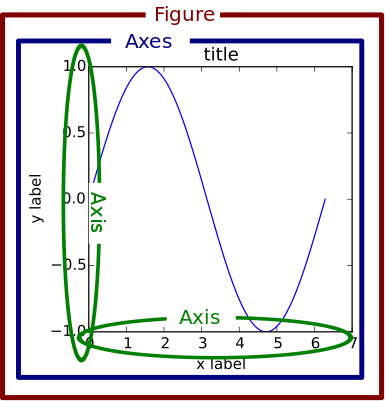
matplotlib 그림의 구성 요소 2
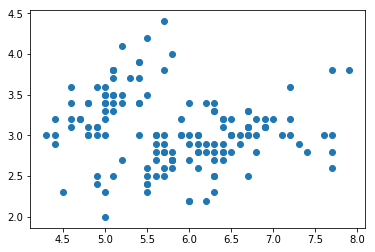
Figure와 Axes
fig, ax = plt.subplots()
ax.scatter(iris['sepal_length'], iris['sepal_width'])
plt.show()
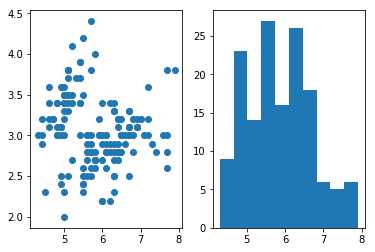
여러 Axes 사용
fig, (ax1, ax2) = plt.subplots(1, 2)
ax1.scatter(iris['sepal_length'], iris['sepal_width'])
ax2.hist(iris['sepal_length'])
plt.show()
기억하기
fig, ax = plt.subplots()
sns.regplot(x='sepal_length', y='sepal_width',
            data=iris, fit_reg=False, ax=ax)
plt.show()
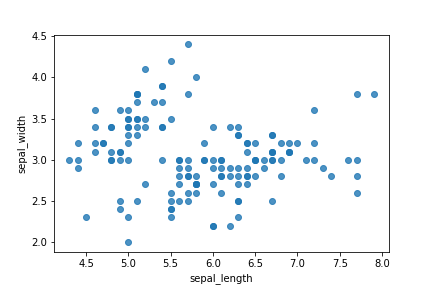
Figure 초기화
fig, (ax1, ax2) = plt.subplots(1, 2)
ax1.scatter(iris['sepal_length'], iris['sepal_width'])
ax2.hist(iris['sepal_length'])
plt.show()
plt.clf()

