pandas로 직접 시각화하기
R 사용자용 Python

Daniel Chen
Instructor
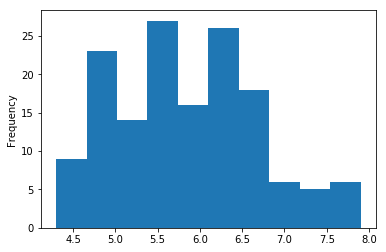
단변량: 히스토그램
import matplotlib.pyplot as plt
iris['sepal_length'].plot(kind='hist')
plt.show()
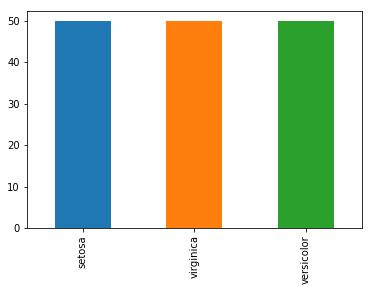
단변량: 막대 그래프
cts = iris['species'].value_counts()
cts.plot(kind='bar')
plt.show()
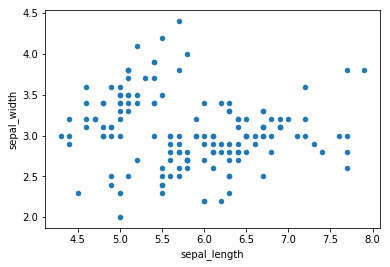
이변량: 산점도
iris.plot(kind='scatter', x='Sepal.Length', y='Sepal.Width')
plt.show()
이변량: 박스플롯
iris.plot(kind='box')
plt.show()
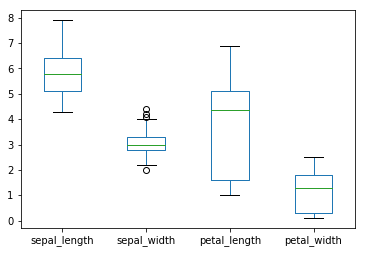
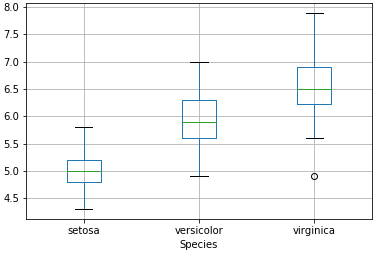
이변량: 박스플롯
iris.boxplot(by='Species', column='Sepal.Length')
plt.show()