데이터 조작과 시각화
사례 연구: R로 도시 시계열 데이터 분석

Lore Dirick
Manager of Data Science Curriculum at Flatiron School
시계열 데이터 그리기
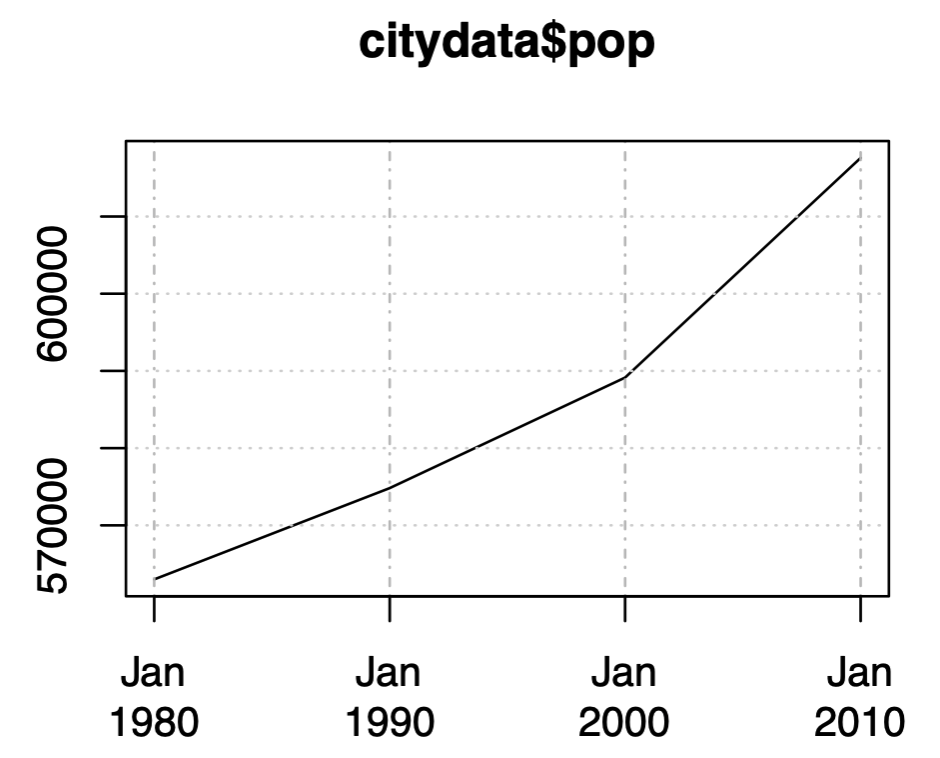
plot.xts(citydata$pop)
시계열 데이터 그리기
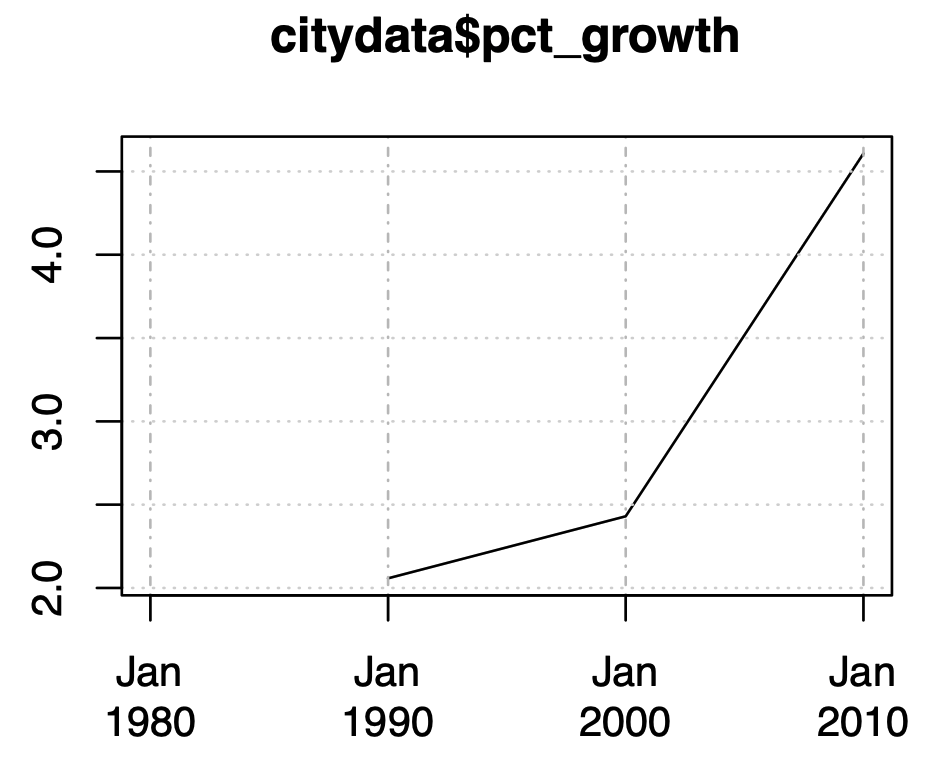
citydata$pct_growth <- (diff(citydata$pop) / citydata$pop) * 100
plot.xts(citydata$pct_growth)
사례 연구: R로 도시 시계열 데이터 분석
Lore Dirick
Manager of Data Science Curriculum at Flatiron School
plot.xts(citydata$pop)
citydata$pct_growth <- (diff(citydata$pop) / citydata$pop) * 100
plot.xts(citydata$pct_growth)

