R로 배우는 Feature Engineering
Jorge Zazueta
Research Professor and Head of the Modeling Group at the School of Economics, UASLP
도메인 지식은 특정 모델이나 작업에 적합한 유용한 특징을 식별하고 생성하게 합니다.
특징 공학은 기존 변수에서 새로운 입력 특징을 만드는 작업입니다.
도메인 지식 예시:
다음 특징 벡터를 기반으로 호텔 취소를 예측합니다.
features <-
c("IsCanceled", "LeadTime",
"arrival_date",
"StaysInWeekendNights",
"StaysInWeekNights",
"PreviousCancellations",
"PreviousBookingsNotCanceled",
"ReservedRoomType",
"AssignedRoomType","BookingChanges",
"DepositType","CustomerType",
"ADR","TotalOfSpecialRequests")
원시 데이터에서 만든 특징
arrival_date에서 유용한 특징을 생성할 수 있습니다.

하지만 곧 번거로워집니다. 자동화가 필요합니다!
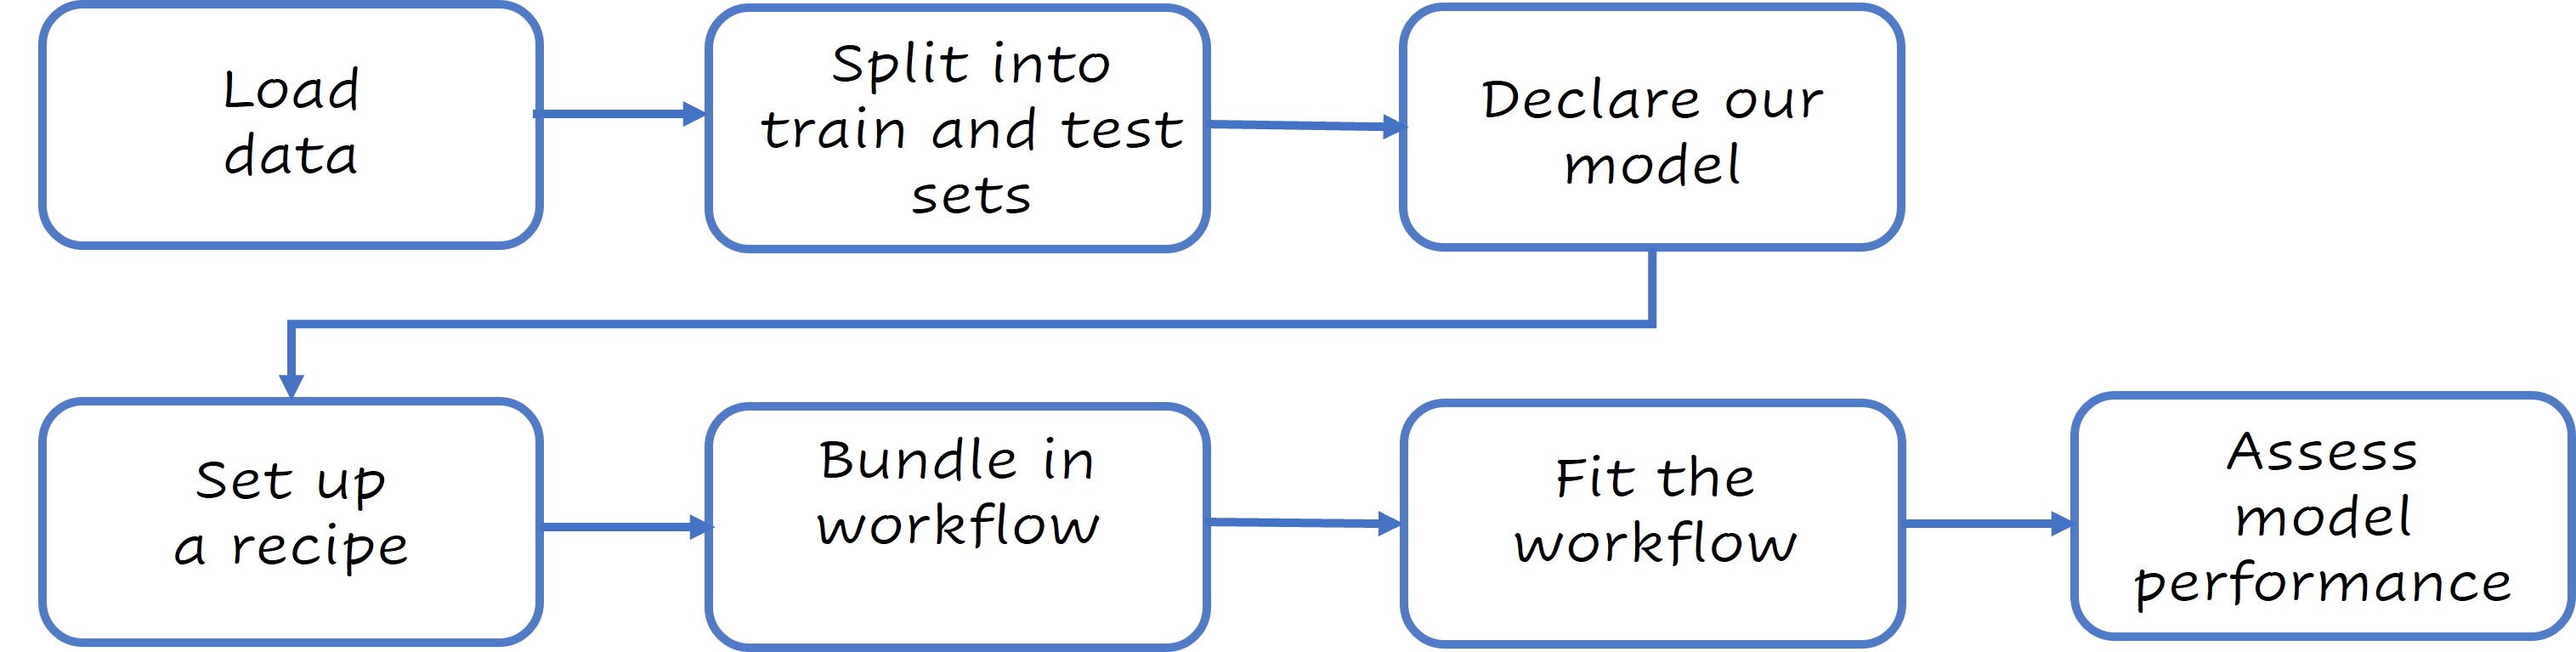
tidymodels 워크플로를 사용하겠습니다. 이는 tidyverse 원칙(1)을 따르는 모델링/머신러닝 패키지 모음으로, 특징 공학에 중점을 둡니다.

자세한 내용: www.tidymodels.org
데이터 준비부터 시작하겠습니다.
cancelations <-
cancelations %>%
mutate(across(where(is_character),as.factor))
set.seed(123)
split <- cancellations %>%
initial_split(
strata = "IsCanceled")
train <- training(split)
test <- testing(split)
prop 매개변수로 학습/테스트 분할 비율을 변경할 수 있습니다(기본값 3/4).
initial_split(data, prop = 3/4, strata = NULL)
train과 test 세트에서 취소 비율이 유사한지 확인하십시오.
train %>%
select(IsCanceled) %>% table() %>%
prop.table()
IsCanceled
0 1
0.5826946 0.4173054
test %>%
select(IsCanceled) %>% table() %>%
prop.table()
IsCanceled
0 1
0.5827788 0.4172212
모델 선언
lr_model <- logistic_reg()
레시피 작성
lr_recipe <-
recipe(IsCanceled ~., data = train) %>%
update_role(Agent, new_role = "ID" ) %>%
step_date(arrival_date,
features = c("dow", "week", "month")) %>%
step_holiday(arrival_date,
holidays = timeDate::listHolidays("US")) %>%
step_rm(arrival_date) %>%
step_dummy(all_nominal_predictors())
lr_recipe 출력
DNT_CURLY_TAG_3
Recipe
Inputs:
role #variables
ID 1
outcome 1
predictor 13
Operations:
Date features from arrival_date
Holiday features from arrival_date
Variables removed arrival_date
Dummy variables from all_nominal_predictors()
모델과 레시피를 workflow 객체로 묶습니다.
lr_workflow <-
workflow()%>%
add_model(lr_model)%>%
add_recipe(lr_recipe)
워크플로 적합
lr_fit <-
lr_workflow %>%
fit(data = train)
tidy(lr_fit)으로 모델 요약을 볼 수 있습니다.
# A tibble: 65 × 5
term estimate std.error statistic p.value
<chr> <dbl> <dbl> <dbl> <dbl>
1 (Intercept) -1.92 0.228 -8.43 3.57e- 17
2 LeadTime 0.00414 0.000268 15.4 1.16e- 53
3 StaysInWeekendNights 0.0860 0.0382 2.25 2.45e- 2
4 StaysInWeekNights 0.0804 0.0185 4.34 1.40e- 5
5 PreviousCancellations 2.39 0.147 16.2 2.45e- 59
6 PreviousBookingsNotCanceled -0.440 0.0450 -9.77 1.45e- 22
7 BookingChanges -0.449 0.0463 -9.69 3.18e- 22
8 ADR 0.0104 0.000782 13.2 4.85e- 40
9 TotalOfSpecialRequests -0.727 0.0316 -23.0 5.29e-117
10 arrival_date_week 0.0245 0.0171 1.43 1.53e- 1
# … with 55 more rows
# ℹ Use `print(n = ...)` to see more rows
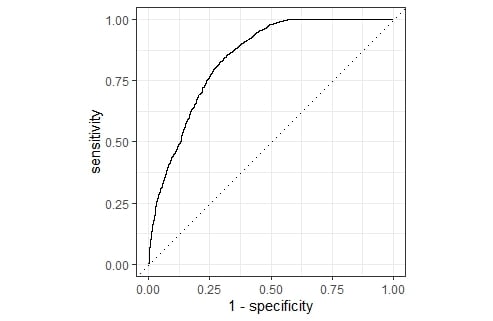
이제 모델 성능을 평가합니다.
lr_aug <- lr_fit %>% augment(test)
bind_rows(
lr_aug %>%
roc_auc(truth = IsCanceled,.pred_0),
lr_aug %>%
accuracy(truth = IsCanceled,.pred_class))
# A tibble: 2 × 3
.metric .estimator .estimate
<chr> <chr> <dbl>
1 roc_auc binary 0.842
2 accuracy binary 0.782
lr_aug %>%
roc_curve(truth = IsCanceled, .pred_0) %>%
autoplot()
R로 배우는 Feature Engineering