원시 데이터의 정보량 높이기

R로 배우는 Feature Engineering

Jorge Zazueta

Research Professor and Head of the Modeling Group at the School of Economics, UASLP

원시 데이터 다루기

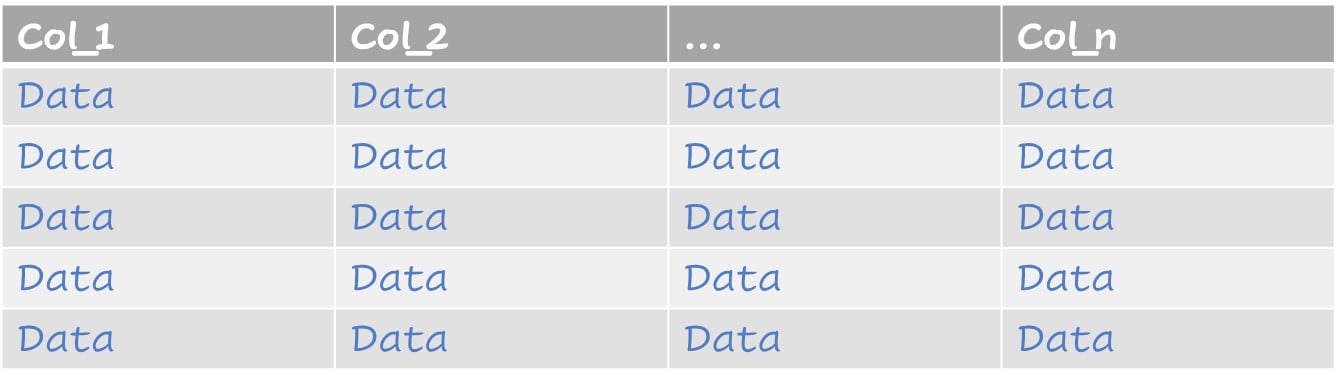
결측값이 있는 일반적 데이터셋
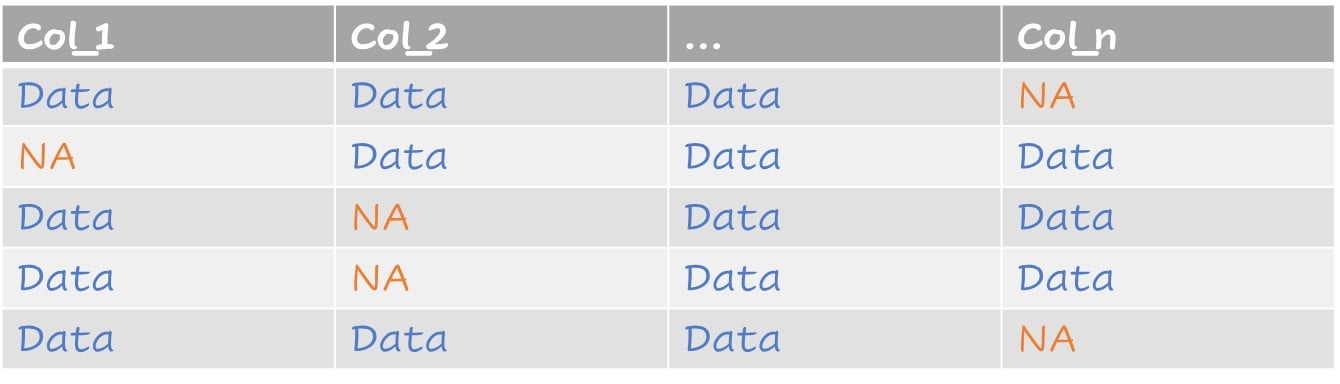
결측 데이터를 보여주는 예시 표

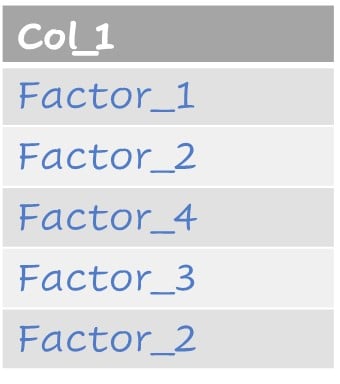
값을 범주형으로 처리

범주형 데이터 예시 표

R로 배우는 Feature Engineering

원시 데이터 다루기

보정된 값이 있는 데이터셋

보정 후 결측이 없는 표

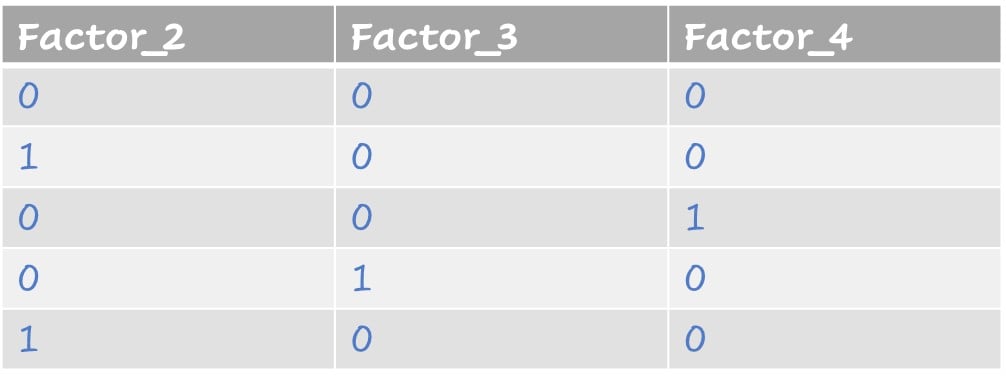
범주형을 더미 변수로 표현

범주형을 더미 변수로 표현

R로 배우는 Feature Engineering

대출 데이터셋

# A tibble: 614 × 13
   Loan_ID  Gender Married Dependents Educa…¹ Self_…² Appli…³ Coapp…⁴ LoanA…⁵ Loan_…⁶
   <fct>    <fct>  <fct>   <fct>      <fct>   <fct>     <dbl>   <dbl>   <dbl>   <dbl>
 1 LP001002 Male   No      0          Gradua… No         5849       0      NA     360
 2 LP001003 Male   Yes     1          Gradua… No         4583    1508     128     360
 3 LP001005 Male   Yes     0          Gradua… Yes        3000       0      66     360
 4 LP001006 Male   Yes     0          Not Gr… No         2583    2358     120     360
 5 LP001008 Male   No      0          Gradua… No         6000       0     141     360
 6 LP001011 Male   Yes     2          Gradua… Yes        5417    4196     267     360
 7 LP001013 Male   Yes     0          Not Gr… No         2333    1516      95     360
 8 LP001014 Male   Yes     3+         Gradua… No         3036    2504     158     360
 9 LP001018 Male   Yes     2          Gradua… No         4006    1526     168     360
10 LP001020 Male   Yes     1          Gradua… No        12841   10968     349     360
# … with 604 more rows, 3 more variables: Credit_History <dbl>, Property_Area <fct>,
#   Loan_Status <fct>, and abbreviated variable names ¹​Education, ²​Self_Employed,
#   ³​ApplicantIncome, ⁴​CoapplicantIncome, ⁵​LoanAmount, ⁶​Loan_Amount_Term
# ℹ Use `print(n = ...)` to see more rows, and `colnames()` to see all variable names
R로 배우는 Feature Engineering

결측값

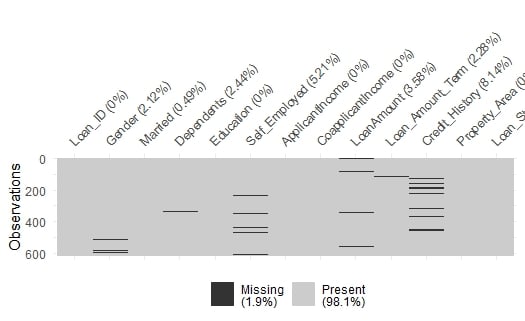
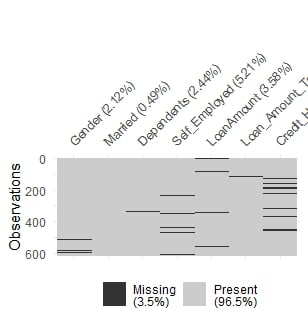
패키지 naniarvis_miss(loans)loans의 결측값을 시각적으로 확인할 수 있습니다.

전체 데이터셋의 결측값을 보여주는 그래프.

R로 배우는 Feature Engineering

결측값

결측값이 있는 열만 선택해 표를 확대해 볼 수 있습니다.

loans %>% 
select(Gender, 
       Married, 
       Dependents,
       Self_Employed,
       LoanAmount,
       Loan_Amount_Term, 
       Credit_History) %>%
  vis_miss()

결측값 자세히 보기

선택한 특성의 결측값을 보여주는 그래프.

R로 배우는 Feature Engineering

결측값과 더미 변수

하나의 레시피에서 결측값 보정과 더미 변수 생성을 함께 처리할 수 있습니다.

lr_recipe <- 
  recipe(Loan_Status ~., 
         data = train) %>%
  update_role(Loan_ID, 
              new_role = "ID" ) %>%
  step_impute_knn(all_predictors()) %>%
  step_dummy(all_nominal_predictors())

레시피 출력

lr_recipe
Recipe

Inputs:

      role #variables
        ID          1
   outcome          1
 predictor         30

Operations:

K-nearest neighbor imputation for all_predictors()
Dummy variables from all_nominal_predictors()
R로 배우는 Feature Engineering

적절한 레시피 단계 찾기

다른 보정 방법과 모든 레시피 단계는 tidymodels 문서에서 확인할 수 있습니다: www.tidymodels.org/find/recipes
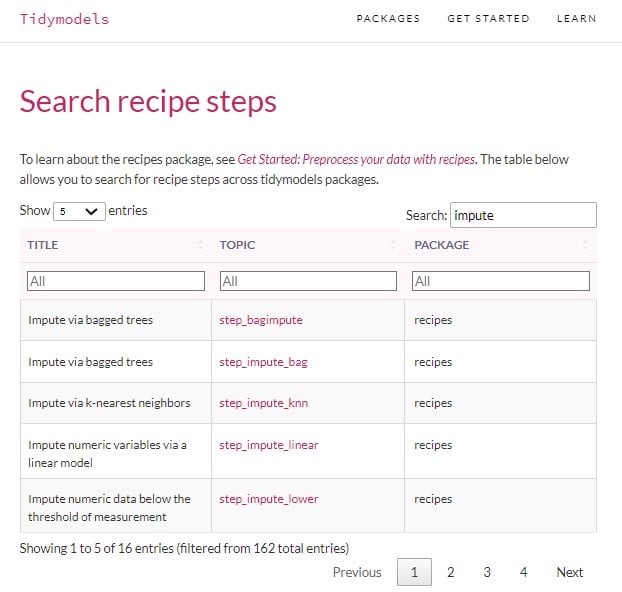
tidymodels 문서의 레시피 단계 검색 도구.

R로 배우는 Feature Engineering

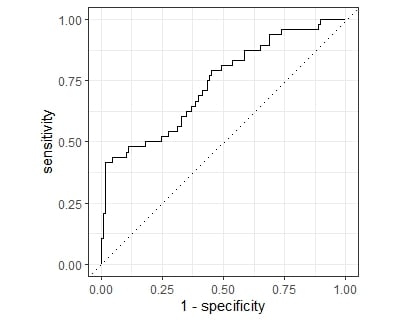
모델 적합 및 평가

# Fit
lr_fit <- 
  lr_workflow %>% fit(data = train)
lr_aug <- 
  lr_fit %>% augment(test)
# Assess
lr_aug %>%
  roc_curve(truth = Loan_Status, .pred_N) %>%
  autoplot()

bind_rows(lr_aug %>%
            roc_auc(truth = Loan_Status,
                    .pred_N),
          lr_aug %>%
            accuracy(truth = Loan_Status,
                     .pred_class))
# A tibble: 2 × 3
  .metric  .estimator .estimate
  <chr>    <chr>          <dbl>
1 roc_auc  binary         0.738
2 accuracy binary         0.792
R로 배우는 Feature Engineering

Ayo berlatih!

R로 배우는 Feature Engineering

Preparing Video For Download...