지도 학습으로 범주형 데이터 인코딩

R로 배우는 Feature Engineering

Jorge Zazueta

Research Professor and Head of the Modeling Group at the School of Economics, UASLP

지도 인코딩 소개

반면 지도 인코딩은 결과 값을 사용해 명목형 예측 변수에서 수치형 특성을 도출합니다.

R로 배우는 Feature Engineering

지도 인코딩 소개

지도 인코딩은 결과 값을 사용해 명목형 예측 변수에서 수치형 특성을 도출합니다.

embed 패키지의 지도 인코딩 함수

Function Definition
step_lencode_glm() 일반화 선형모형에서 도출한 점수로 명목형 예측 변수를 하나의 점수로 변환합니다.
step_lencode_bayes() 베이지안 분석으로 추정한 일반화 선형모형의 점수를 사용해 명목형 예측 변수를 하나의 점수로 변환합니다.
step_lencode_mixed() 일반화 선형 혼합모형에서 도출한 점수로 명목형 예측 변수를 하나의 점수로 변환합니다.
R로 배우는 Feature Engineering

지원 성공 예측하기

스폰서 코드만으로 지원서 성공 여부를 예측합니다.

lr_model <- logistic_reg() # declare model

lr_recipe_glm <- # Set recipe glm
  recipe(class ~ sponsor_code, 
         data = grants_train) %>%
  step_lencode_glm(sponsor_code, 
                   # Declare outcome variable
                   outcome = vars(class))

lr_workflow_glm <- # Create Workflow
  workflow() %>%
  add_model(lr_model) %>%
  add_recipe(lr_recipe_glm)

워크플로 요약

lr_workflow_glm
-- Workflow ------------------------------------
Preprocessor: Recipe
Model: logistic_reg()

-- Preprocessor --------------------------------
1 Recipe Step

- step_lencode_glm()

-- Model --------------------------------------
Logistic Regression Model Specification (classification)

Computational engine: glm
R로 배우는 Feature Engineering

적합, 보강, 평가

모델을 적합하고 평가합니다.

lr_fit_glm <- # Fit
  lr_workflow_glm %>%
  fit(grants_train)

lr_aug_glm <- # Augment
  lr_fit_glm %>%
  augment(grants_test)

glm_model <- lr_aug_glm %>% # Assess
  class_evaluate(truth = class,
                 estimate = .pred_class,
                 .pred_successful)

성능 결과는 glm_model에 저장됩니다.

DNT_CURLY_TAG_3

glm_model


# A tibble: 2 × 3 .metric .estimator .estimate <chr> <chr> <dbl> 1 accuracy binary 0.728 2 roc_auc binary 0.684
R로 배우는 Feature Engineering

모델 결합하기

각 단계의 성능을 비교하기 위해 bayes_modelmixed_model을 만듭니다.

# Define model names
model <- c("glm", "glm",
           "bayes","bayes",
           "mixed", "mixed")
# Bind models in a tibble
models <- 
bind_rows(glm_model,
          bayes_model,
          mixed_model)%>%
  add_column(model = model)%>%
  select(-.estimator) %>%
  spread(model,.estimate)

편리한 성능 표

models
# A tibble: 2 × 4
  .metric  bayes   glm mixed
  <chr>    <dbl> <dbl> <dbl>
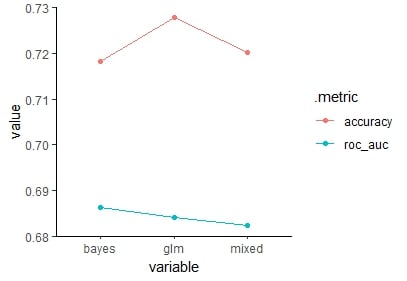
1 accuracy 0.718 0.728 0.720
2 roc_auc  0.686 0.684 0.682
R로 배우는 Feature Engineering

결과 시각화

Gally 패키지의 평행좌표 차트로 결과를 시각화합니다.

# Libraries
library(GGally)

# Parallel coordinates chart
ggparcoord(models,
           columns = 2:4, 
           groupColumn = 1,
           scale="globalminmax",
           showPoints = TRUE)

모든 모델의 accuracy와 roc_auc에 대한 평행좌표 차트

모든 모델의 accuracy와 roc_auc에 대한 평행좌표 차트

R로 배우는 Feature Engineering

연습해 봅시다!

R로 배우는 Feature Engineering

Preparing Video For Download...