broom으로 모델 정리하기

Tidyverse로 배우는 Machine Learning

Dmitriy (Dima) Gorenshteyn

Lead Data Scientist, Memorial Sloan Kettering Cancer Center

리스트 열 워크플로
Tidyverse로 배우는 Machine Learning

리스트 열 워크플로

Tidyverse로 배우는 Machine Learning

Broom 툴킷

  • tidy(): 모델의 통계 결과(계수 등)를 반환합니다.

  • glance(): 모델의 간결한 한 행 요약을 반환합니다.

  • augment(): 모델링 데이터에 예측 열을 추가합니다.

Tidyverse로 배우는 Machine Learning

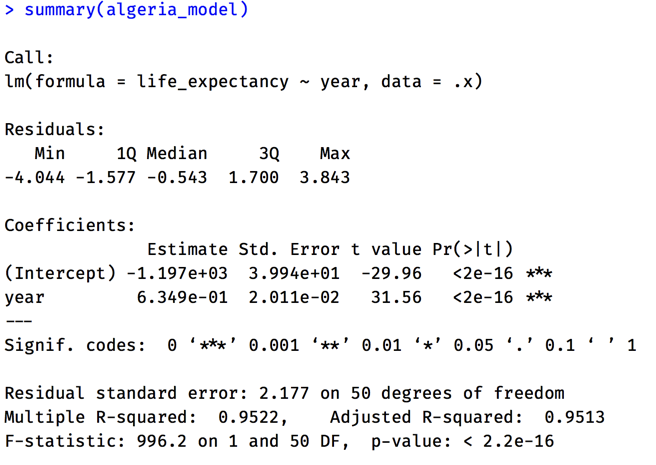
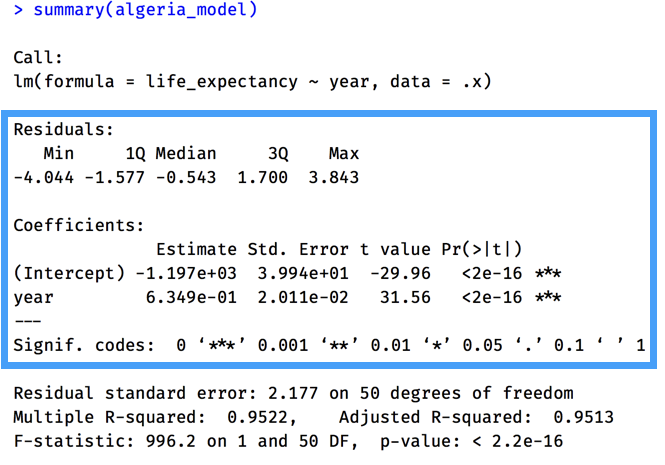
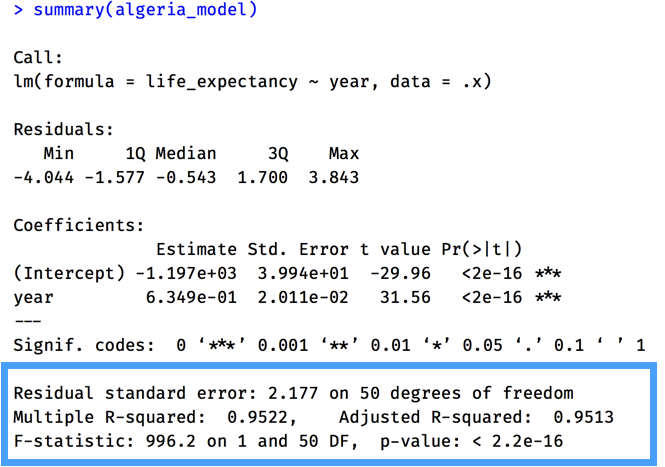
algeria_model 요약

Tidyverse로 배우는 Machine Learning

tidy()

Tidyverse로 배우는 Machine Learning

tidy()

library(broom)

tidy(algeria_model)
         term      estimate   std.error statistic      p.value
1 (Intercept) -1196.5647772 39.93891866 -29.95987 1.319126e-33
2        year     0.6348625  0.02011472  31.56209 1.108517e-34
Tidyverse로 배우는 Machine Learning

glance()

Tidyverse로 배우는 Machine Learning

glance()

glance(algeria_model)
r.squared adj.r.squared    sigma statistic      p.value df    
0.9522064     0.9512505 2.176948  996.1653 1.108517e-34  2 
logLik        AIC       BIC           deviance    df.residual
-113.2171     232.4342  238.288       236.9552     50
Tidyverse로 배우는 Machine Learning

augment()

augment(algeria_model)
   life_expectancy year  .fitted   .se.fit     .resid       .hat   .sigma 
1            47.50 1960 47.76581 0.5951714 -0.2658128 0.07474601 2.198695 
2            48.02 1961 48.40068 0.5779264 -0.3806753 0.07047725 2.198326 
3            48.55 1962 49.03554 0.5608726 -0.4855379 0.06637924 2.197878 
4            49.07 1963 49.67040 0.5440279 -0.6004004 0.06245198 2.197265 
5            49.58 1964 50.30526 0.5274124 -0.7252630 0.05869547 2.196455 
6            50.09 1965 50.94013 0.5110485 -0.8501255 0.05510971 2.195498 
Tidyverse로 배우는 Machine Learning

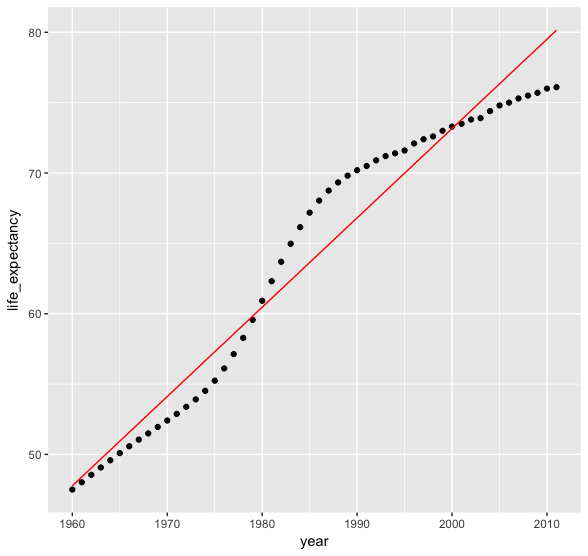
증강 데이터 시각화

augment(algeria_model) %>% 
  ggplot(mapping = aes(x = year)) +
  geom_point(mapping = aes(y = life_expectancy)) +
  geom_line(mapping = aes(y = .fitted), color = "red")
Tidyverse로 배우는 Machine Learning

broom을 사용해 봅시다!

Tidyverse로 배우는 Machine Learning

Preparing Video For Download...