Python으로 미국 인구조사 데이터 분석하기
Lee Hachadoorian
Asst. Professor of Instruction, Temple University
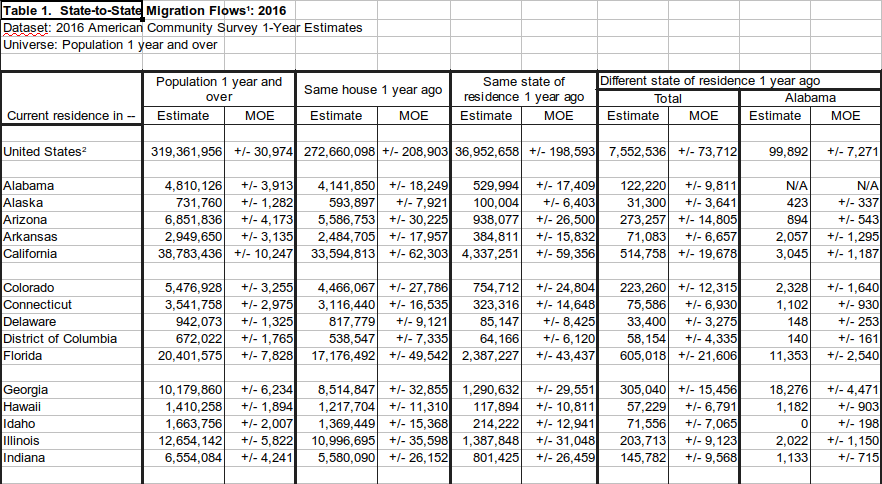
테이블명은 일반적으로 "B07xxx"이며, 대개 다음과 같은 열을 가집니다:
print(to_cali_2016)
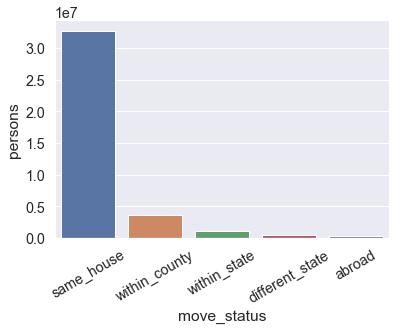
move_status persons
0 same_house 32740745
1 within_county 3581323
2 within_state 1062756
3 different_state 501384
4 abroad 305148
sns.barplot(x = "move_status",
y = "persons",
data = to_cali_2016)
데이터 출처: ACS 2016 표 B07001: 미국 현 거주지 기준 연령별 지난 1년 지리적 이동


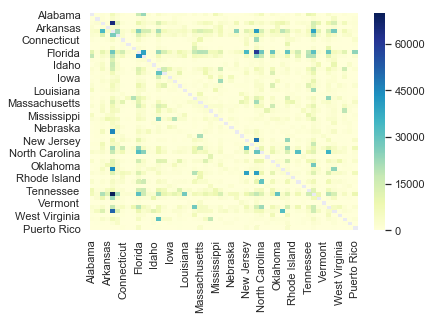
print(state_to_state.head())
Alabama Alaska Arizona ... Wisconsin Wyoming Puerto Rico
Alabama NaN 576.0 1022.0 ... 874.0 539.0 335.0
Alaska 423.0 NaN 1176.0 ... 260.0 291.0 848.0
Arizona 894.0 1946.0 NaN ... 6736.0 925.0 1462.0
Arkansas 2057.0 103.0 836.0 ... 539.0 178.0 857.0
California 3045.0 4206.0 33757.0 ... 7354.0 2674.0 1102.0
sns.heatmap(state_to_state, cmap="YlGnBu")
Python으로 미국 인구조사 데이터 분석하기