임대료가 너무 비싼가요?
Python으로 미국 인구조사 데이터 분석하기

Lee Hachadoorian
Asst. Professor of Instruction, Temple University
정의
임대료 산정 방식:
- 계약 임대료: 임대차 계약서상의 임대료
- 총임대료: 임대료 + 공과금; 일부는 계약 임대료에 포함, 일부는 세입자가 별도 납부
임대료 부담 기준:
- 임대료 부담: 가구 소득의 30% 이상을 임대료로 지출
- 심각한 임대료 부담: 가구 소득의 50% 이상을 임대료로 지출
B25074표: 지난 12개월 가구소득 대비 총임대료 비율별 가구수
Total
    Less than $10,000
        Less than 20.0 percent
        20.0 to 24.9 percent
        25.0 to 29.9 percent
        30.0 to 34.9 percent
        35.0 to 39.9 percent
        40.0 to 49.9 percent
        50.0 percent or more
        Not computed
    $10,000 to $19,999
    $20,000 to $34,999
    $35,000 to $49,999
    $50,000 to $74,999
    $75,000 to $99,999
    $100,000 or more
미국 소득 대비 임대료 비중, ACS 2012-2016
total                                     42835169
inc_under_10k                              5558843
inc_under_10k_rent_under_20_pct              57052
inc_under_10k_rent_20_to_25_pct              58042
inc_under_10k_rent_25_to_30_pct             208806
inc_under_10k_rent_30_to_35_pct             177709
inc_under_10k_rent_35_to_40_pct             102565
inc_under_10k_rent_40_to_50_pct             150153
inc_under_10k_rent_over_50_pct             3381537
inc_under_10k_rent_not_computed            1422979
inc_10k_to_20k                             7027373
inc_10k_to_20k_rent_under_20_pct            213000
etc...
임대료 부담 계산
print(rent.columns[10:19])
Index(['inc_10k_to_20k', 'inc_10k_to_20k_rent_under_20_pct',
   'inc_10k_to_20k_rent_20_to_25_pct', 'inc_10k_to_20k_rent_25_to_30_pct',
   'inc_10k_to_20k_rent_30_to_35_pct', 'inc_10k_to_20k_rent_35_to_40_pct',
   'inc_10k_to_20k_rent_40_to_50_pct', 'inc_10k_to_20k_rent_over_50_pct',
   'inc_10k_to_20k_rent_not_computed'],
  dtype='object')
임대료 부담 계산
rent["inc_10k_to_20k_rent_burden"] = 100 * (rent["inc_10k_to_20k_rent_30_to_35_pct"] + rent["inc_10k_to_20k_rent_35_to_40_pct"] + rent["inc_10k_to_20k_rent_40_to_50_pct"] + rent["inc_10k_to_20k_rent_over_50_pct"]) / ( rent["inc_10k_to_20k"] - rent["inc_10k_to_20k_rent_not_computed"] )
임대료 부담 계산
print(rent["inc_10k_to_20k_rent_burden"])
0    87.008024
Name: inc_10k_to_20k_rent_burden, dtype: float64
반복문으로 임대료 부담 계산
# Create list with income category part of column names
incomes = ["inc_under_10k", "inc_10k_to_20k", "inc_20k_to_35k",
           "inc_35k_to_50k", "inc_50k_to_75k", "inc_75k_to_100k",
           "inc_over_100k"]
반복문으로 임대료 부담 계산
# Create new DataFrame with just the geography name rent_burden = rent["name"] # Loop over the list of income categories for income in incomes:# Construct column names rent_burden[income] =100 * (rent[income + "_rent_30_to_35_pct"] + rent[income + "_rent_35_to_40_pct"] + rent[income + "_rent_40_to_50_pct"] + rent[income + "_rent_over_50_pct"]) / ( rent[income] - rent[income + "_rent_not_computed"])
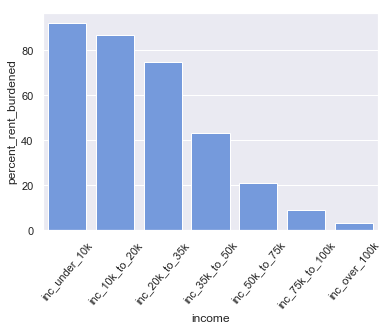
미국: 소득 구간별 임대료 부담
print(rent_burden.squeeze())
name               United States
inc_under_10k            92.1685
inc_10k_to_20k            87.008
inc_20k_to_35k           74.7448
inc_35k_to_50k           43.0434
inc_50k_to_75k           21.0937
inc_75k_to_100k          9.11853
inc_over_100k            3.14882
Name: 0, dtype: object
연습해 봅시다!
Python으로 미국 인구조사 데이터 분석하기

