과정에 오신 것을 환영합니다!
R에서 수치형 데이터에 대한 추론

Mine Cetinkaya-Rundel
Associate Professor of the Practice, Duke University
맨해튼 임대료
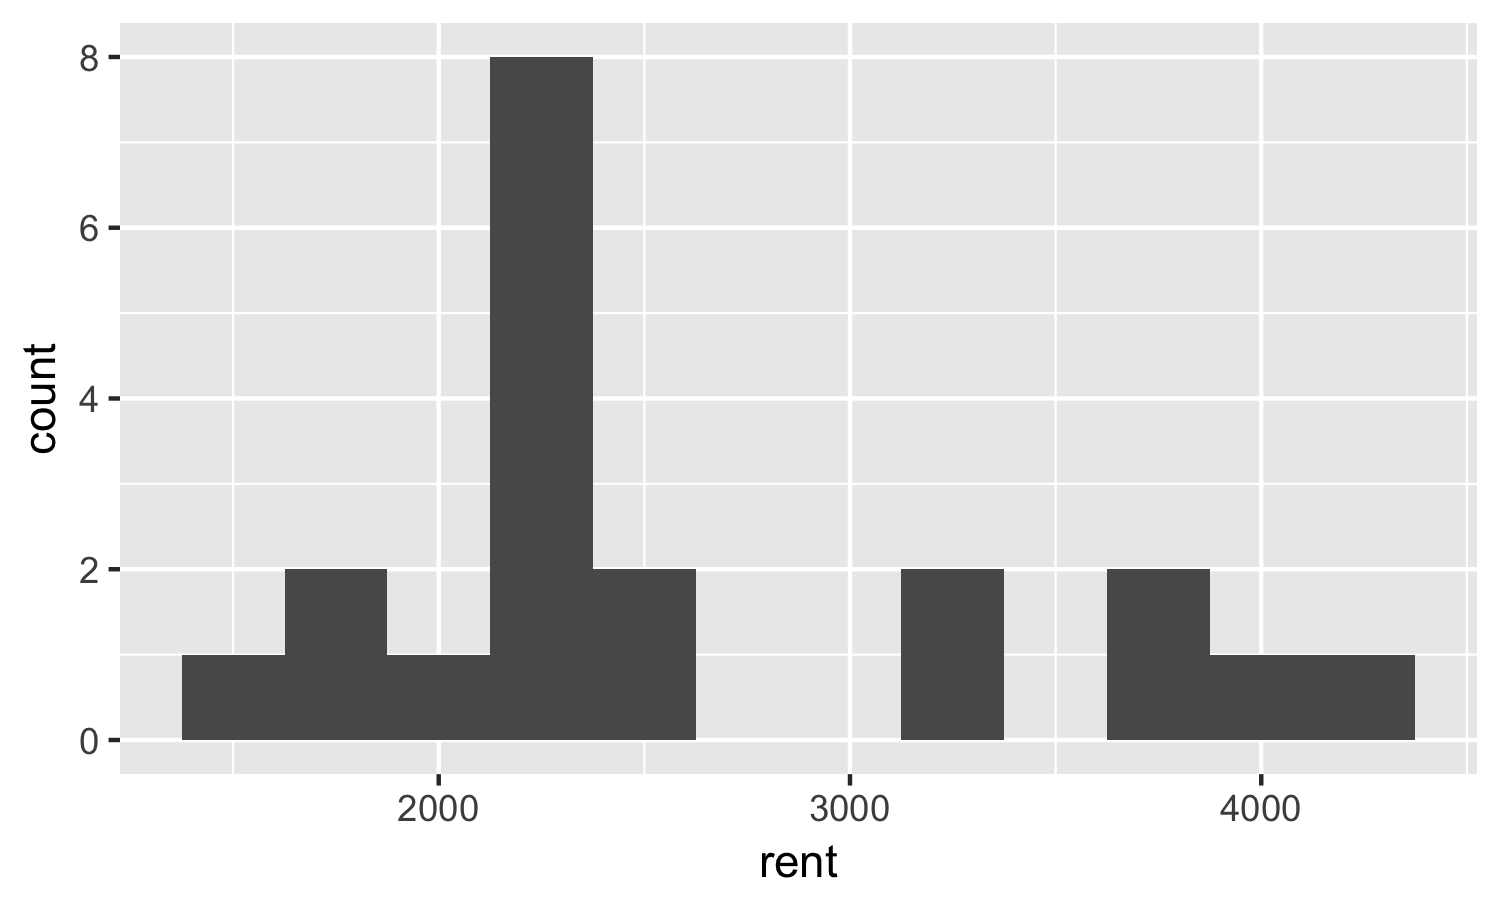
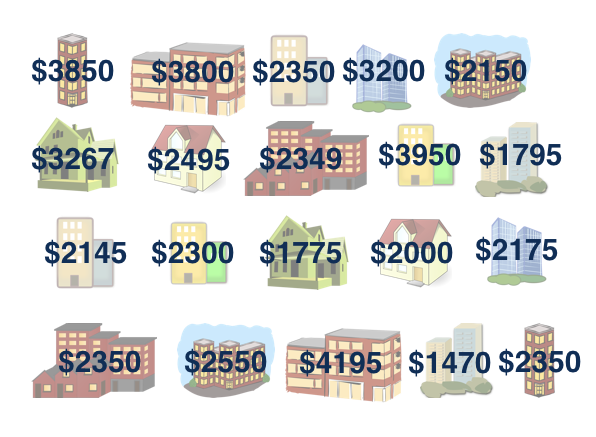
관측 표본
표본 중앙값 = $2,350
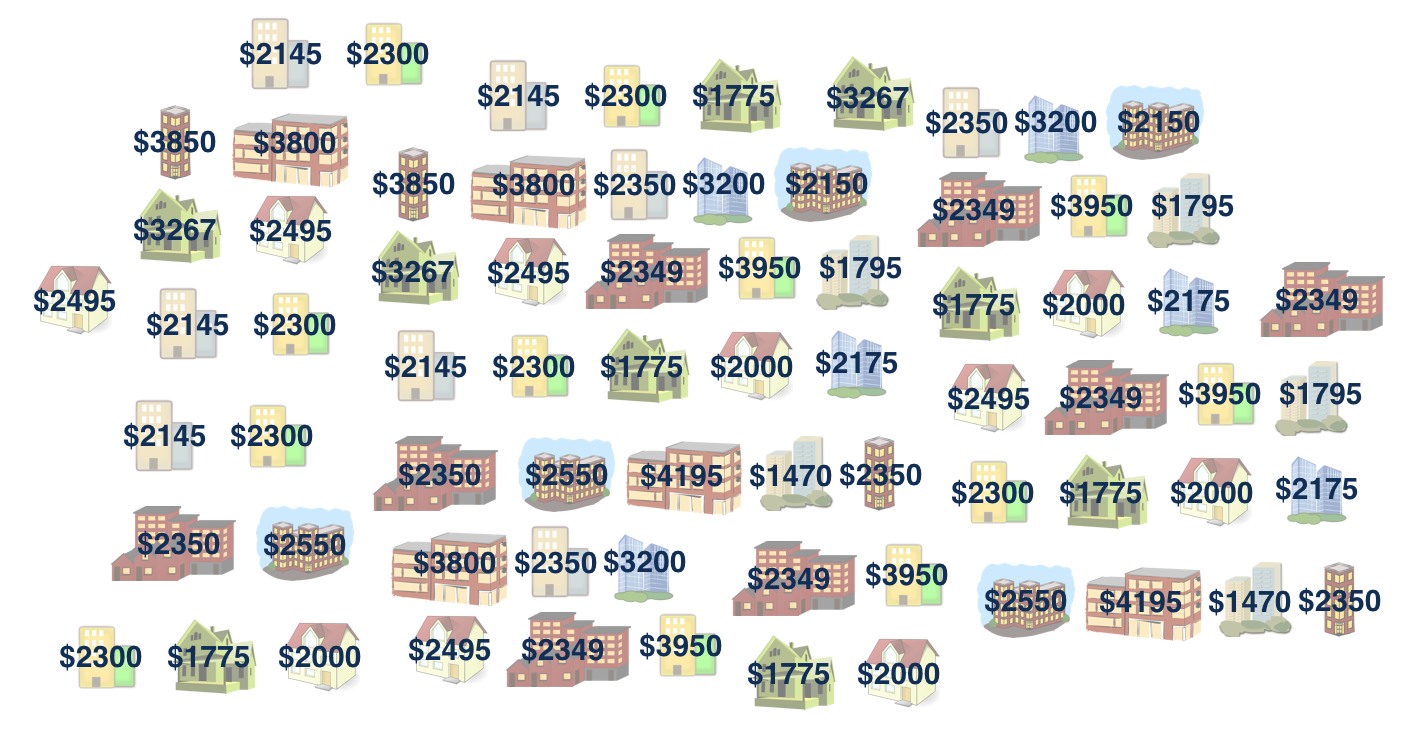
부트스트랩 모집단
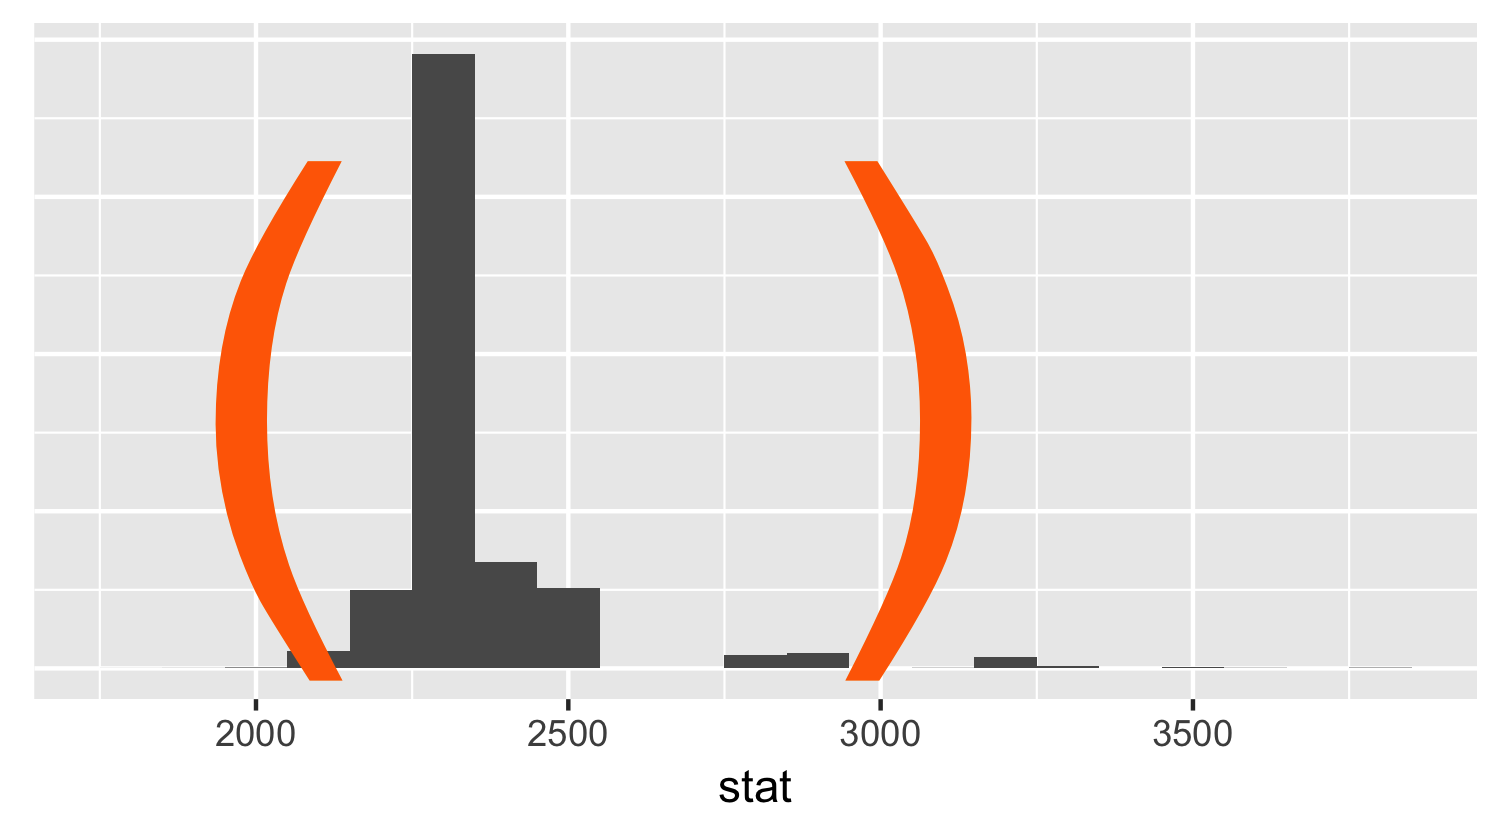
부트스트랩 신뢰구간 구성
library(infer)

___ %>%                               # start with data frame
  specify(response = ___) %>%         # specify the variable of interest
generate(reps = ___, type = "bootstrap") %>% # generate bootstrap samples
calculate(stat = "___") # calculate bootstrap statistic
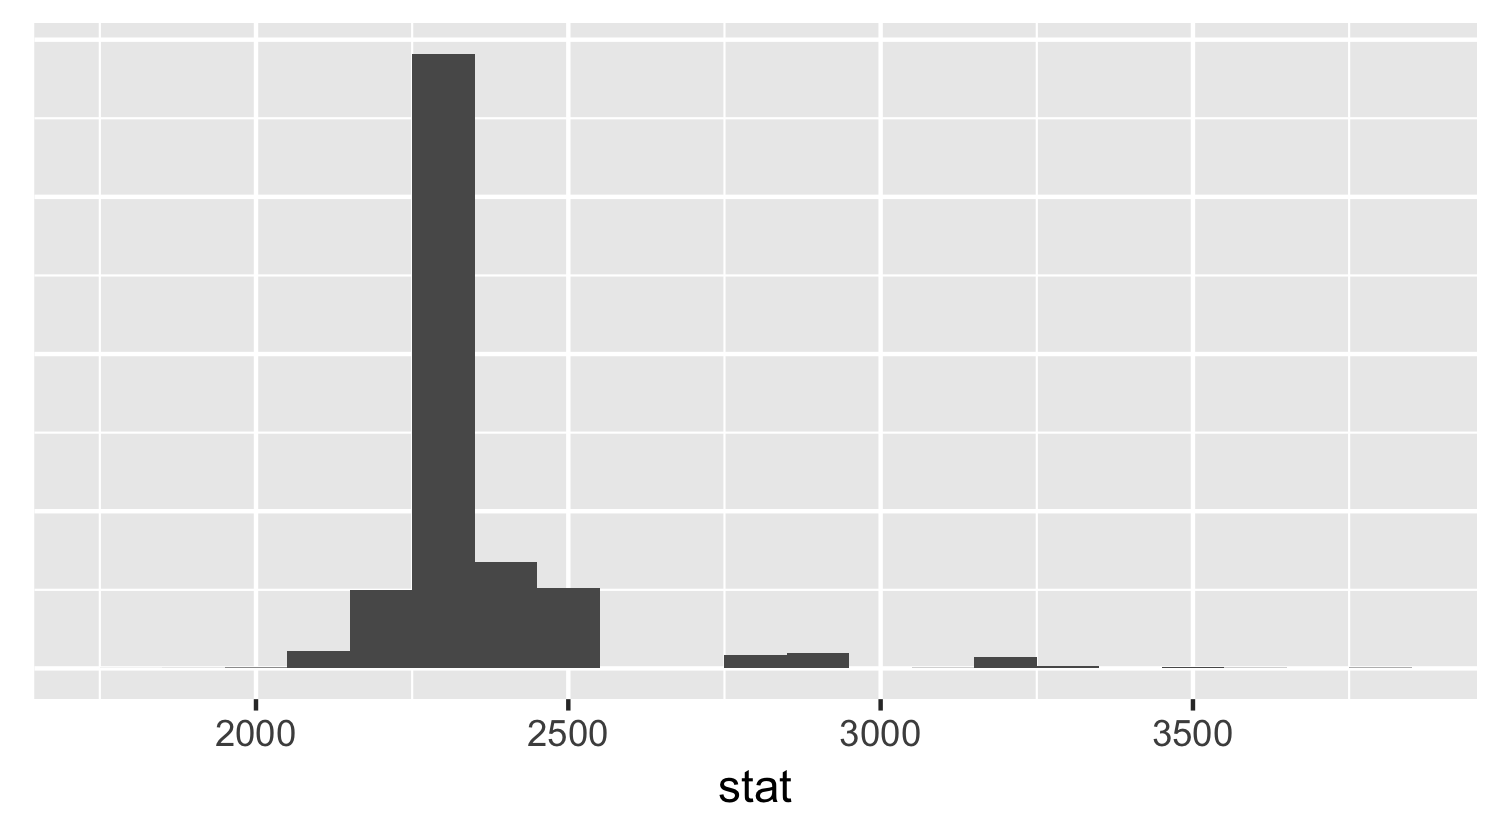
부트스트랩 신뢰구간 구성
library(infer)

___ %>%                               # start with data frame
  specify(response = ___) %>%         # specify the variable of interest
  generate(reps = ___, type = "bootstrap") %>%  # generate bootstrap samples
calculate(stat = "___") # calculate bootstrap statistic