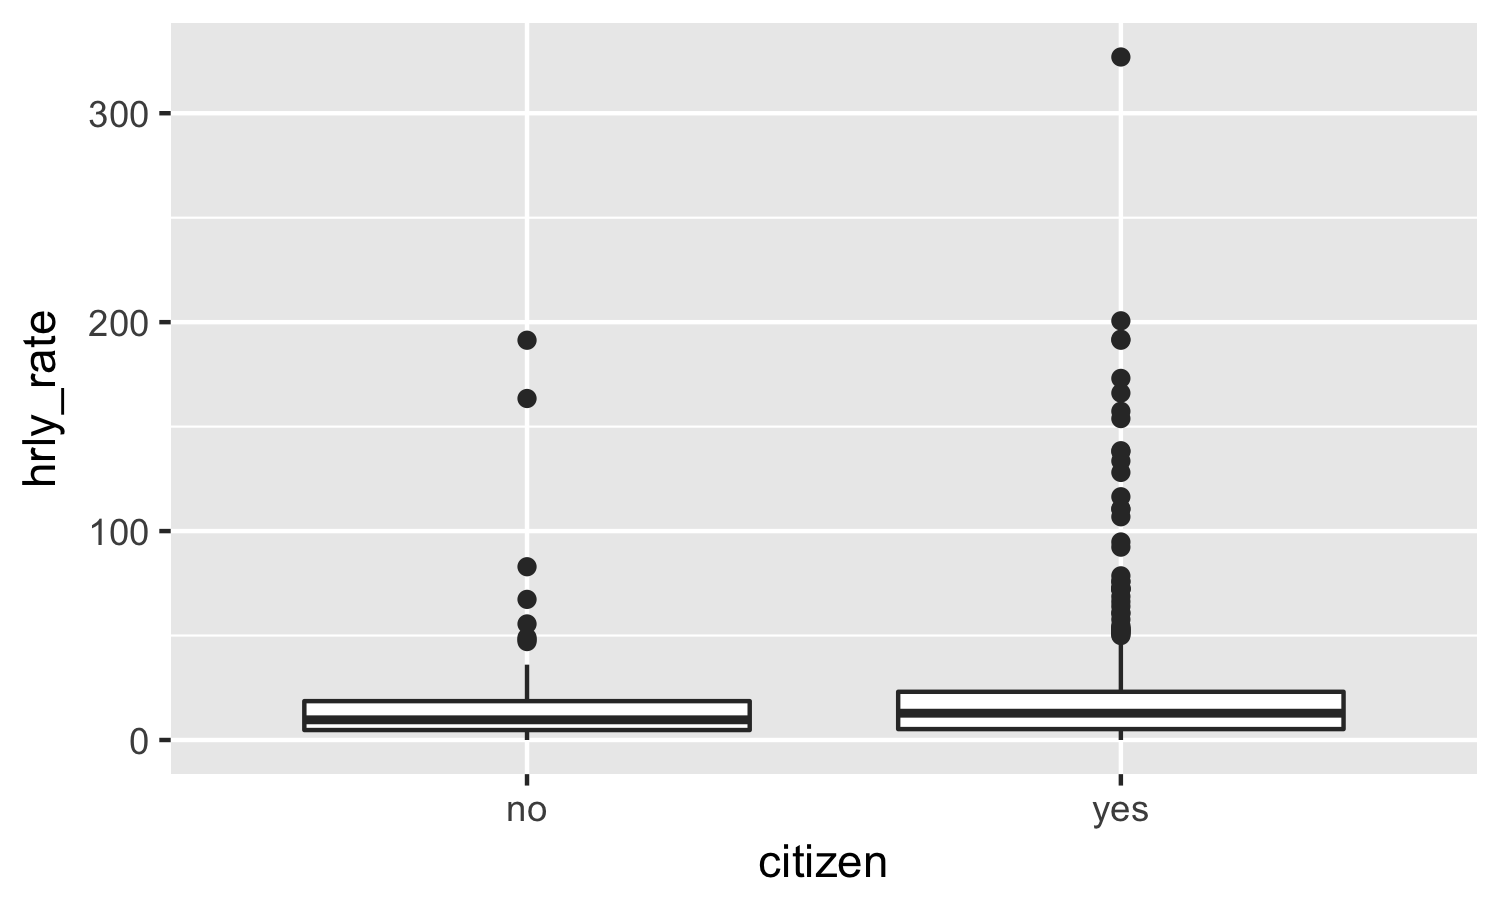
$H_A: \mu_{citizen} \ne \mu_{non-citizen}$ $\rightarrow$ alternative = "two.sided"
검정 수행
t.test(hrly_rate ~ citizen, data = acs12, null = 0,
       alternative = "two.sided")
    Welch Two Sample t-test
data:  hrly_rate by citizen
t = 0.58058, df = 60.827, p-value = 0.5637
alternative hypothesis: true difference in means is not equal to 0
95 percent confidence interval:
 -6.53483 11.88170
sample estimates:
 mean in group no mean in group yes
         21.19494          18.52151
조건
독립성:
각 표본 내 관측값은 서로 독립이어야 합니다.
두 표본은 서로 독립이어야 합니다.
표본 크기 / 왜도: 원래 데이터의 왜도가 클수록, 대칭적인 표본 분포를 얻기 위해 더 큰 표본 크기가 필요합니다.