맨-휘트니 U 검정

R로 배우는 A/B Testing

Lauryn Burleigh

Data Scientist

맨-휘트니 U
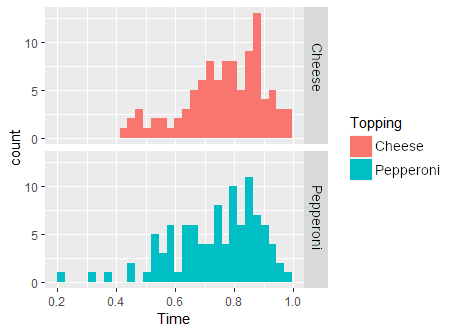
  • 치즈 vs 페퍼로니 피자 섭취 시간
  • 비정규 분포
  • 비모수
    • 분포 형태 가정 없음
    • 맨-휘트니 U 검정

왼쪽으로 치우친 히스토그램 2개. 분홍색 페퍼로니 평균 8, 파란색 치즈 평균 6.2.

R로 배우는 A/B Testing

가정

  • 동일한 분포 형태
  • 중앙값 차이를 평가
  • 정규분포: 평균 = 중앙값
  • 비정규분포: 중앙값이 더 적절
  • 추가 가정 시 더 강력한 검정
  • 귀무가설: 치즈와 페퍼로니의 섭취 중앙값 차이 없음
library(ggplot2)
ggplot(pizza, aes(x = Time, 
                  fill = Topping)) +
       geom_histogram() + 
       facet_grid(Topping~.)

왼쪽으로 치우친 히스토그램 2개. 분홍색 페퍼로니 평균 8, 파란색 치즈 평균 6.2.

R로 배우는 A/B Testing

표본 크기

library(pwr)
pwr.2p2n.test(h = 0.40, 
              sig.level = 0.05, 
              power = 0.8, n1 = 100)
    difference of proportion power 
 calculation for binomial distribution
              h = 0.4
             n1 = 100
             n2 = 96.29156
      sig.level = 0.05
          power = 0.8
    alternative = two.sided
NOTE: different sample sizes
pwr.2p2n.test(h = 0.40, 
              sig.level = 0.05, 
              power = 0.8, n1 = 110)
    difference of proportion power 
 calculation for binomial distribution
              h = 0.4
             n1 = 110
             n2 = 88.54092
      sig.level = 0.05
          power = 0.8
    alternative = two.sided
NOTE: different sample sizes
  • 예상 효과 크기 h: 순서-이항 상관 r
    • 그룹 간 순위 비교
R로 배우는 A/B Testing

검정

wilcox.test(Time ~ Topping, 
            data = Pizza)
  • y ~ x
    • y: 데이터
    • x: 그룹
    Wilcoxon rank sum test with 
    continuity correction
data:  Enjoyment by Topping
W = 6051, p-value = 0.01026
alternative hypothesis: true location 
shift is not equal to 0
R로 배우는 A/B Testing

효과 크기와 검정력

효과 크기

library(effectsize)
rank_biserial(Time ~ Topping, 
              data = pizza)
r (rank biserial) |         95% CI
<----------------------------------
0.21              | [0.05, 0.36]
  • 작음: 0.1
  • 보통: 0.3
  • 큼: 0.5

1 - 0.14 = 0.86 제2종 오류 확률

검정력 분석

library(pwr)
pwr.2p2n.test(h = 0.21, sig.level = 0.01, 
              n1 = 100, n2 = 100)
     difference of proportion power calculation for binomial distribution 

              h = 0.21
             n1 = 100
             n2 = 100
      sig.level = 0.01
          power = 0.1376818
    alternative = two.sided

NOTE: different sample sizes
R로 배우는 A/B Testing

연습해 봅시다!

R로 배우는 A/B Testing

Preparing Video For Download...