semPaths()로 다이어그램 생성
R에서 lavaan으로 배우는 구조방정식모형

Erin Buchanan
Professor
semPaths() 기본 출력
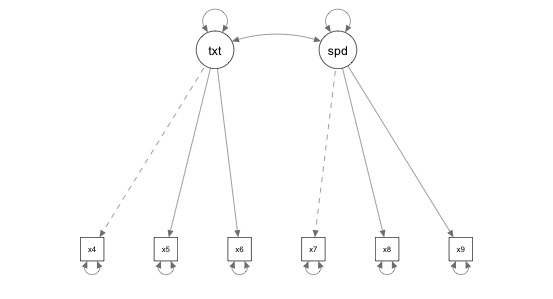
그림 편집
semPaths(object = twofactor.fit,
         whatLabels = "std",
         edge.label.cex = 1)
#whatLabels can also be "par"
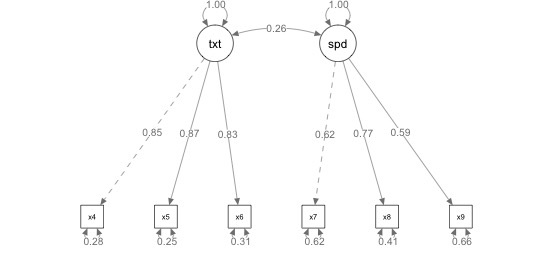
그림 레이아웃
semPaths(object = twofactor.fit,
          whatLabels = "std",
          edge.label.cex = 1,
          layout = "circle")
#layout options are tree, circle, spring, tree2, circle2
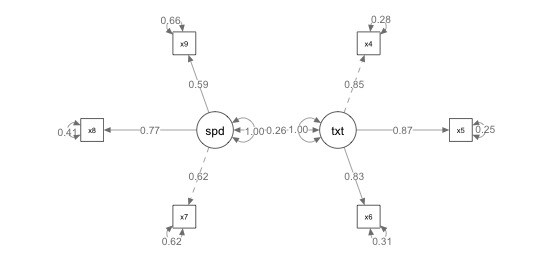
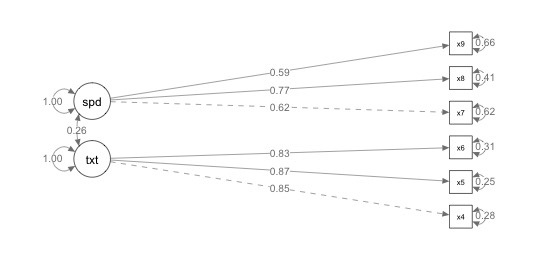
그림 회전
semPaths(object = twofactor.fit,
          whatLabels = "std",
          edge.label.cex = 1,
          layout = "tree", rotation = 2)
#rotation options are 1, 2, 3, 4 for tree layouts
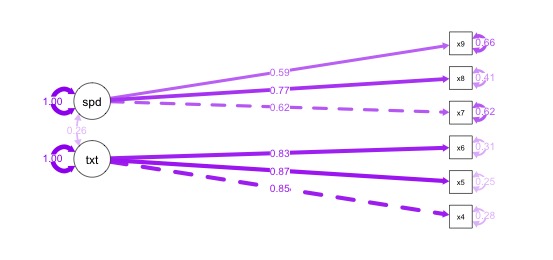
색상 시각화
semPaths(object = twofactor.fit,
         whatLabels = "std",
         edge.label.cex = 1,
         layout = "tree", rotation = 2,
         what = "std", edge.color = "purple")
#what options include par and std