효과 측정
R의 병렬 프로그래밍

Nabeel Imam
Data Scientist
간단한 예제
numbers <- 1:1000000# 순차 sqroots <- lapply(numbers, sqrt)# 병렬 cl <- makeCluster(4) sqroots <- parLapply(cl, numbers, sqrt) stopCluster(my_cluster)
어느 쪽이 더 빠를까요?
성능 벤치마킹
코드를 여러 번 실행해 평균 실행 시간을 추정합니다
library(microbenchmark)microbenchmark( "Sequential" = lapply(numbers, sqrt),"Parallel" = { cl <- makeCluster(4) parLapply(cl, numbers, sqrt) stopCluster(my_cluster) },times = 10 )
Unit: milliseconds
      expr     min    mean     max neval
Sequential  633.96  838.09  993.59    10
  Parallel 1136.95 1247.29 1557.58    10
- 간단한 수치 연산은 병렬화로 이점이 거의 없습니다
- 프로파일링은 줄 단위 보고, 벤치마킹은 전체 실행 시간 비교
모두가 아는 문제
sqroots <- sqrt(numbers)

벡터화
sqroots <- sqrt(numbers)
sqrt()같은 Base R 함수는 벡터화되어 있습니다.- 단일 함수를 여러 입력에 매핑
- 매우 빠르지만 단순 연산에만 적용 가능
microbenchmark(
  "Vectorized" = sqrt(numbers),
  "Sequential" = lapply(numbers, sqrt),
  "Parallel" = {
    cl <- makeCluster(4)
    parLapply(cl, numbers, sqrt)
    stopCluster(my_cluster)
  },
  times = 10)
Unit: milliseconds
      expr       min      mean      max neval
Vectorized    2.3904    9.2071   66.303    10
Sequential  352.1166  771.7491 1004.753    10
  Parallel 1191.3176 1377.6926 1700.316    10
부트스트랩
현재 데이터에서 복원추출로 샘플링
print(ls_df)
$`2001`
   Country             Life_expectancy  Year
 1 Afghanistan                    56.3  2001
 2 Albania                        74.3  2001
 3 Algeria                        71.1  2001
...
$`2002`
   Country             Life_expectancy  Year
 1 Afghanistan                    56.8  2002
 2 Albania                        74.6  2002
 3 Algeria                        71.6  2002
...
고전적 방식
df <- ls_df$`2001`estimates <- rep(0, 10000)for (i in 1:10000) { b <- sample(df$Life_expectancy, replace = T)estimates[i] <- mean(b) }
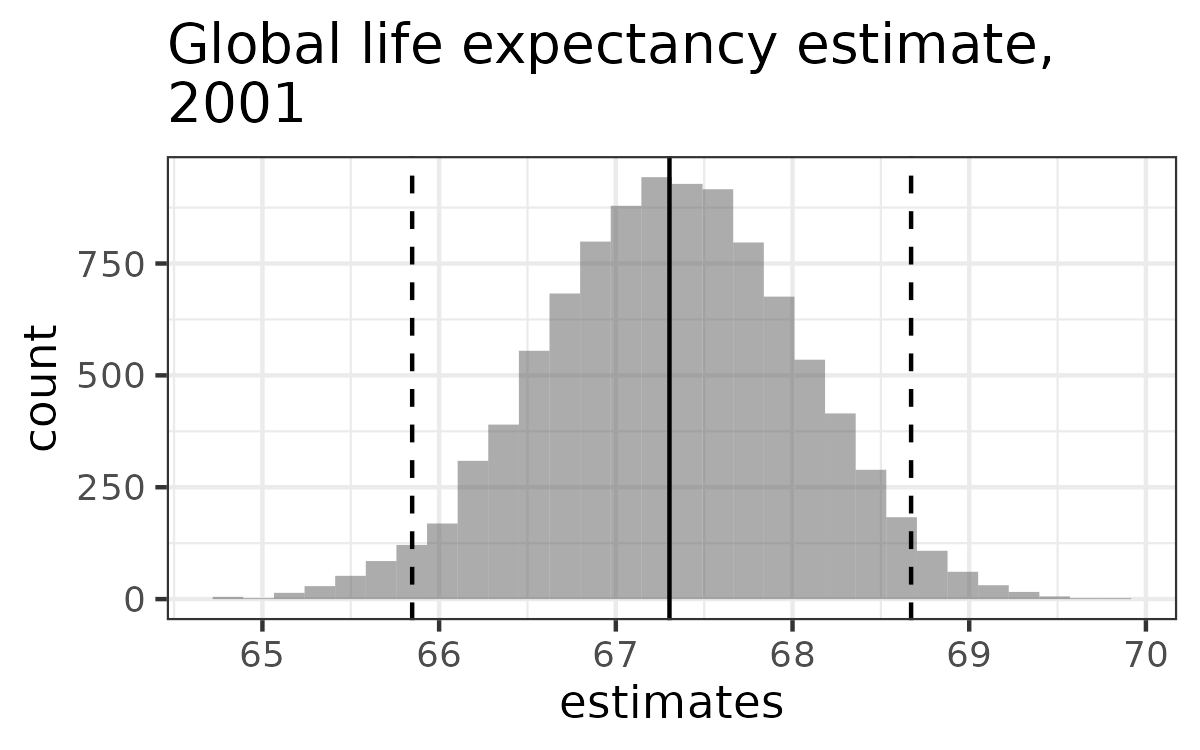
- 분위수 기반 신뢰구간:
quantile(estimates, c(0.025, 0.975))
좋은 소식
부트스트랩은 병렬화할 수 있습니다
estimates <- rep(0, 10000)

for (i in 1:10000) {

  b <- sample(df$Life_expectancy,
              replace = T)

  estimates[i] <- mean(b)
  }
boot_dist <- function (df) { estimates <- rep(0, 10000) for (i in 1:10000) { b <- sample(df$Life_expectancy, replace = T) estimates[i] <- mean(b) } return(estimates) }cl <- makeCluster(4) ls_dists <- parLapply(cl, ls_df, boot_dist) stopCluster(cl)
이점
microbenchmark(
  "lapply" = lapply(ls_df, boot_dist),
  "parLapply" = {
    cl <- makeCluster(4)
    parLapply(cl, ls_df, boot_dist)
    stopCluster(cl)
  },
  times = 10
)
Unit: seconds
     expr    min   mean    max neval
   lapply 3.6938 4.2184 4.5267    10
parLapply 1.9006 2.5166 2.7292    10
접근 방법:
- 기존 코드를 프로파일링해 가장 느린 부분 찾기
- 해당 단계를 병렬화/최적화
- 벤치마크로 비교
Vamos praticar!
R의 병렬 프로그래밍

