상관관계와 t-검정

SAS 사용자를 위한 R

Melinda Higgins, PhD

Research Professor/Senior Biostatistician Emory University

상관관계: SAS vs R
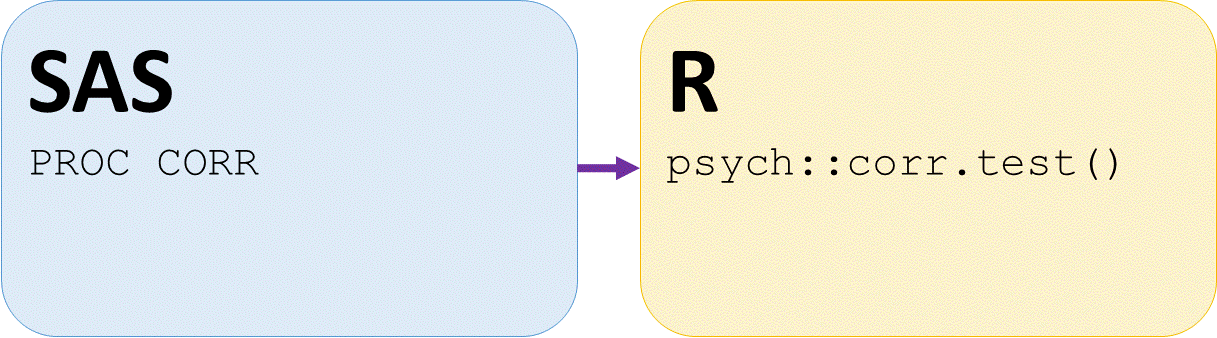
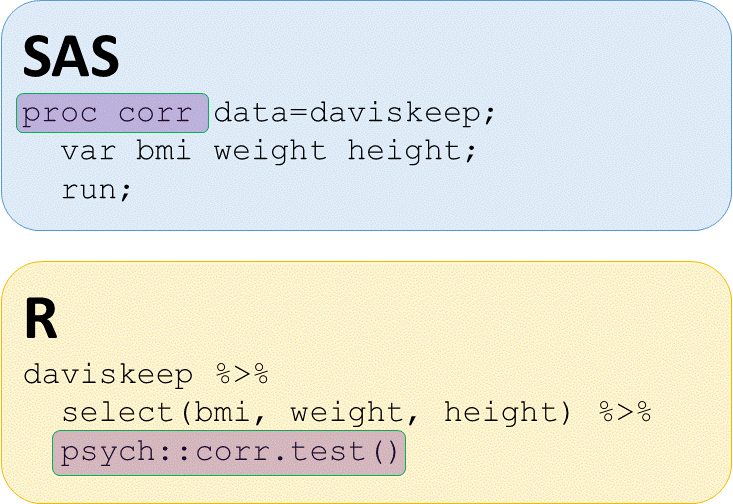
SAS PROC CORR과 유사한 R psych::corr.test 함수

SAS 사용자를 위한 R

상관분석을 위한 SAS와 R 코드

SAS 사용자를 위한 R

psych 패키지로 상관분석

# Correlations with psych::corr.test()
daviskeep %>%
  select(bmi, weight, height) %>%
  psych::corr.test()
Call:psych::corr.test(x = .)
Correlation matrix
        bmi weight height
bmi    1.00   0.88   0.38
weight 0.88   1.00   0.77
height 0.38   0.77   1.00
Sample Size
[1] 199
Probability values (Entries above the
diagonal are adjusted for multiple tests.)
       bmi weight height
bmi      0      0      0
weight   0      0      0
height   0      0      0
SAS 사용자를 위한 R

산점도 행렬: SAS와 R

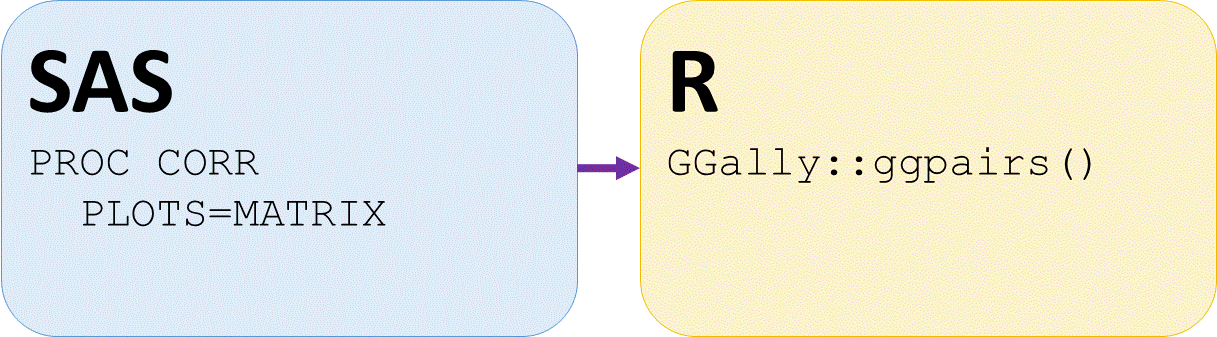
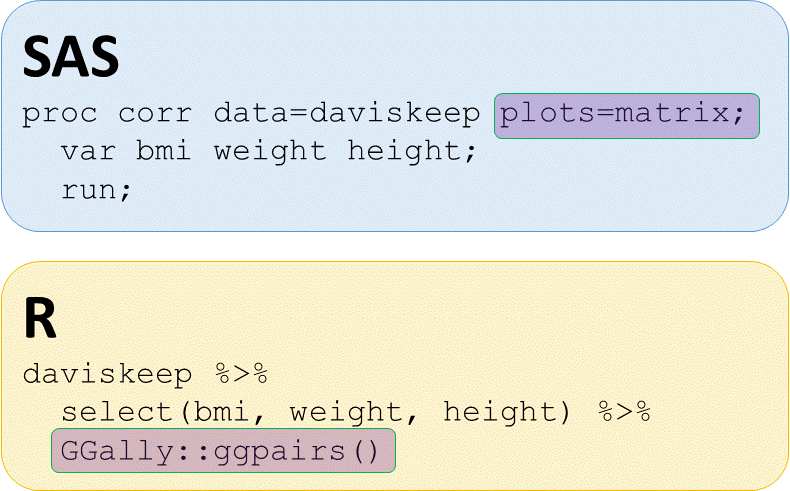
SAS PROC CORR의 plots matrix와 GGally의 ggpairs

SAS 사용자를 위한 R

산점도 행렬을 만드는 SAS와 R 코드

SAS 사용자를 위한 R

산점도 행렬 - GGally::ggpairs() 함수


# Matrix plot with GGally::ggpairs()
daviskeep %>%
  select(bmi, weight, height) %>%
  GGally::ggpairs()

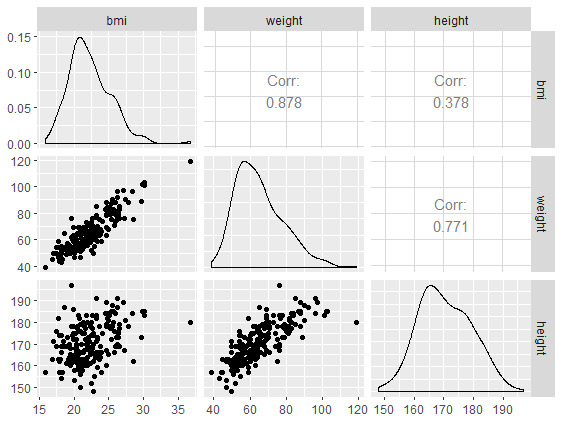
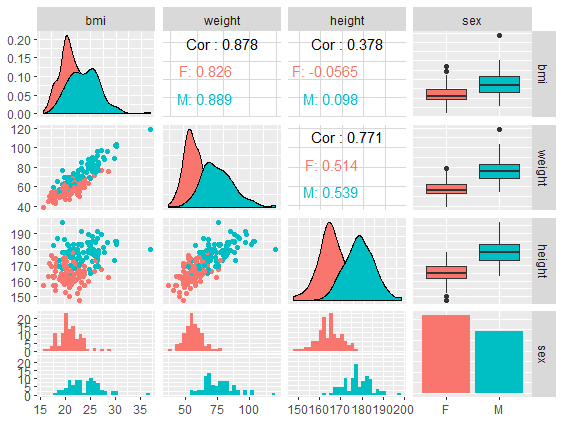
GGally 패키지의 ggpairs 함수로 만든 산점도 행렬

SAS 사용자를 위한 R

산점도 행렬 - 그룹별 ggpairs


# Color points by sex group
daviskeep %>%
  select(bmi, weight, height, sex) %>%
  GGally::ggpairs(aes(color = sex))

GGally 패키지의 ggpairs 함수로 성별 그룹별 산점도 행렬

SAS 사용자를 위한 R

그룹별 기술통계

그룹 크기 없이

# 성별별 bmi의 평균과 표준편차
daviskeep %>% group_by(sex) %>%
  select(sex, bmi) %>%
  summarise(across(everything(),
                   list(mean = ~ mean(.x),
                        sd = ~ sd(.x))))
# A tibble: 2 × 3
  sex   bmi_mean bmi_sd
  <fct>    <dbl>  <dbl>
1 F         21.0   2.18
2 M         23.9   3.12

그룹 크기 포함

# N = n() 추가, 성별별 bmi 평균·표준편차
daviskeep %>% group_by(sex) %>%
  select(sex, bmi) %>%
  summarise(across(everything(), 
                   list(mean = ~ mean(.x), 
                        sd = ~ sd(.x))),
            N = n())
# A tibble: 2 × 4
  sex   bmi_mean bmi_sd     N
  <fct>    <dbl>  <dbl> <int>
1 F         21.0   2.18   111
2 M         23.9   3.12    88
1 https://dplyr.tidyverse.org/reference/context.html
SAS 사용자를 위한 R

t-검정: SAS와 R

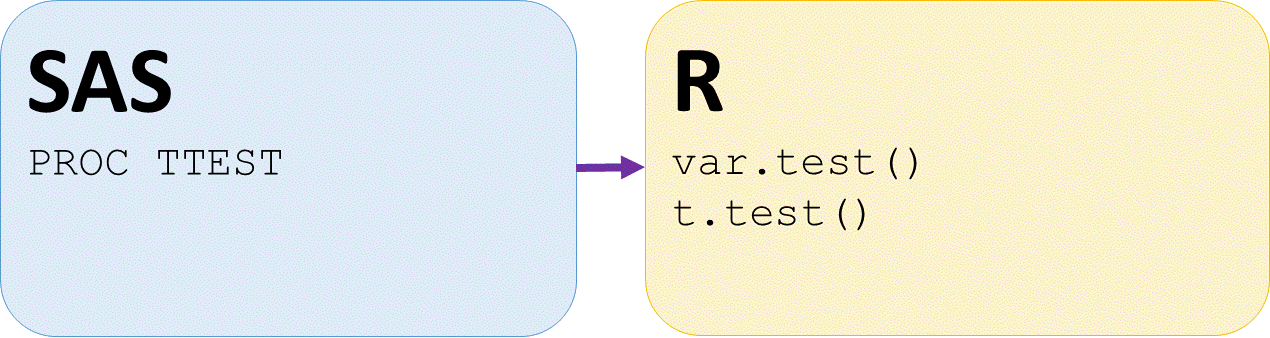
SAS PROC TTEST와 R의 var.test, t.test 비교

SAS 사용자를 위한 R

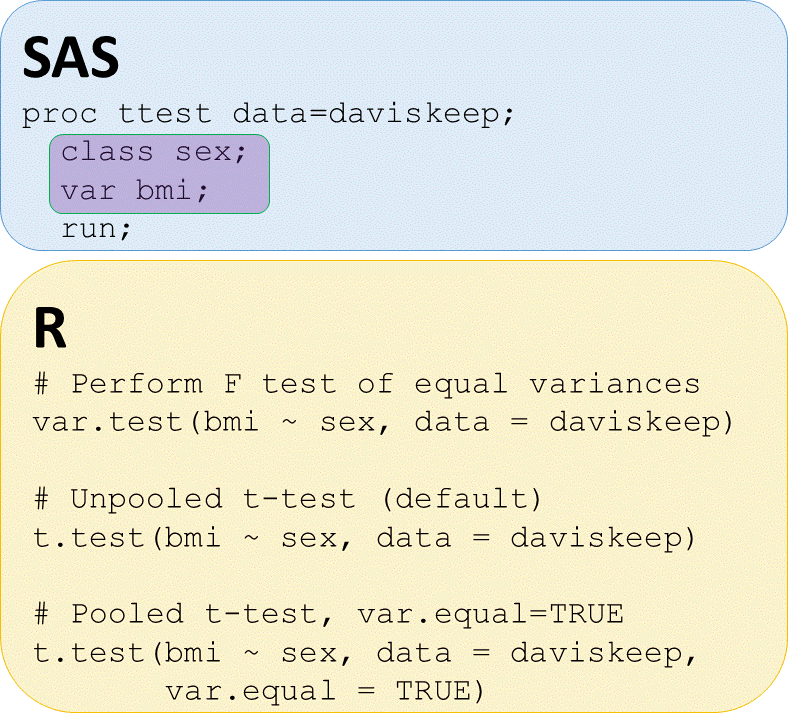
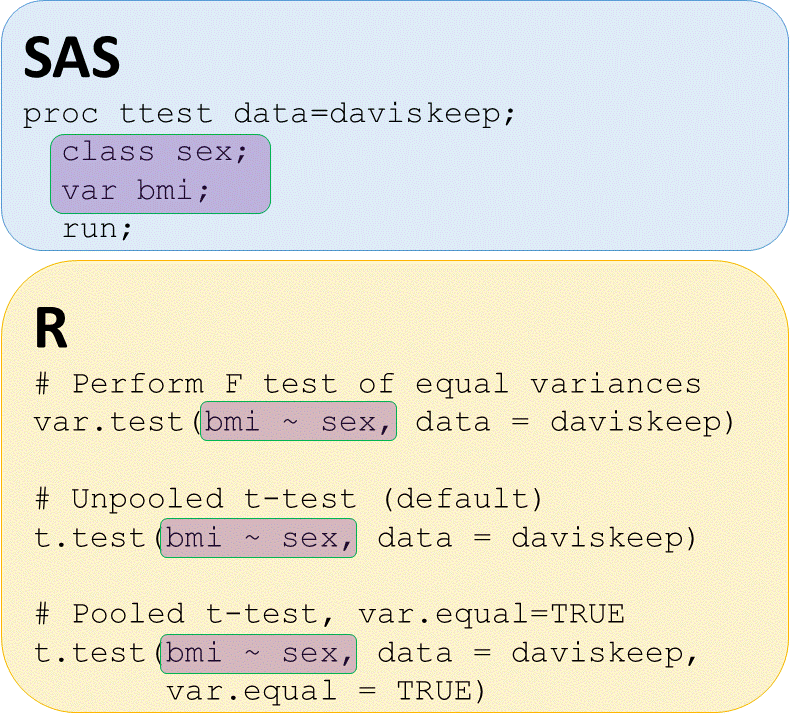
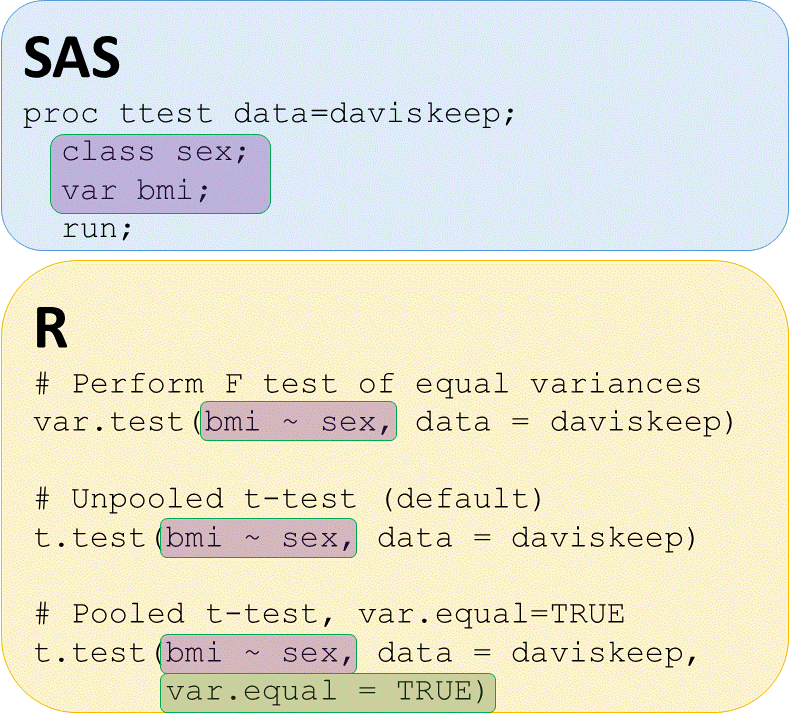
결합/비결합 t-검정의 SAS와 R 코드

SAS 사용자를 위한 R

결합/비결합 t-검정의 SAS와 R 코드

SAS 사용자를 위한 R

결합/비결합 t-검정의 SAS와 R 코드

SAS 사용자를 위한 R

t-검정 - 등분산성 확인

# Perform equal variance test
var.test(bmi ~ sex, data = daviskeep)
    F test to compare two variances

data:  bmi by sex
F = 0.48637, num df = 110, denom df = 87, p-value = 0.0003668

alternative hypothesis: true ratio of variances is not equal to 1

95 percent confidence interval:
 0.3244691 0.7221946
sample estimates:
ratio of variances
         0.4863699
SAS 사용자를 위한 R

t-검정 - 결합 vs 비결합

# UNPOOLED t-test bmi by sex
t.test(bmi ~ sex,
       data = daviskeep)
Welch Two Sample t-test

data:  bmi by sex
t = -7.5158, df = 149.45,
  p-value = 4.819e-12
alternative hypothesis: true difference
  in means is not equal to 0
95 percent confidence interval:
 -3.716353 -2.169035
sample estimates:
mean in group F mean in group M
       20.95632        23.89901
# POOLED t-test bmi by sex
t.test(bmi ~ sex, data = daviskeep,
       var.equal = TRUE)
    Two Sample t-test

data:  bmi by sex
t = -7.8239, df = 197,
  p-value = 3.055e-13
alternative hypothesis: true difference
  in means is not equal to 0
95 percent confidence interval:
 -3.684428 -2.200960
sample estimates:
mean in group F mean in group M
       20.95632        23.89901
SAS 사용자를 위한 R

전복 데이터의 이변량 관계를 살펴봅시다!

SAS 사용자를 위한 R

Preparing Video For Download...