탐색적 데이터 분석

SAS 사용자를 위한 R

Melinda Higgins, PhD

Research Professor/Senior Biostatistician Emory University

요약 통계
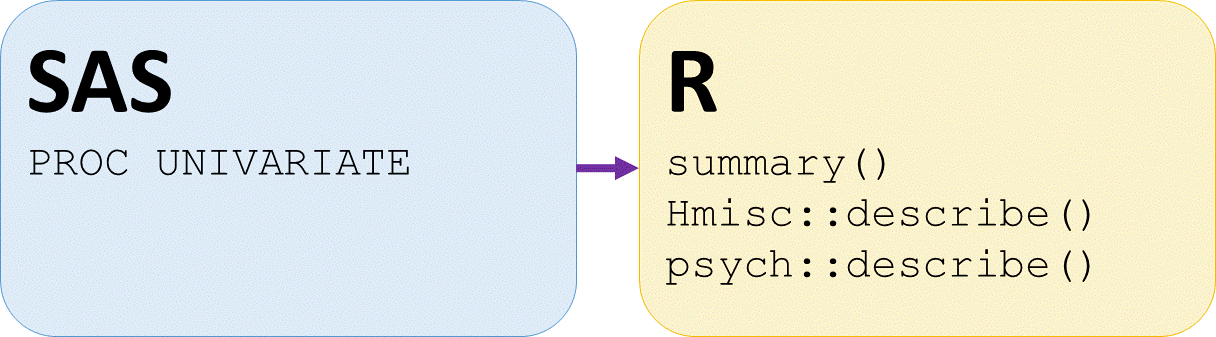
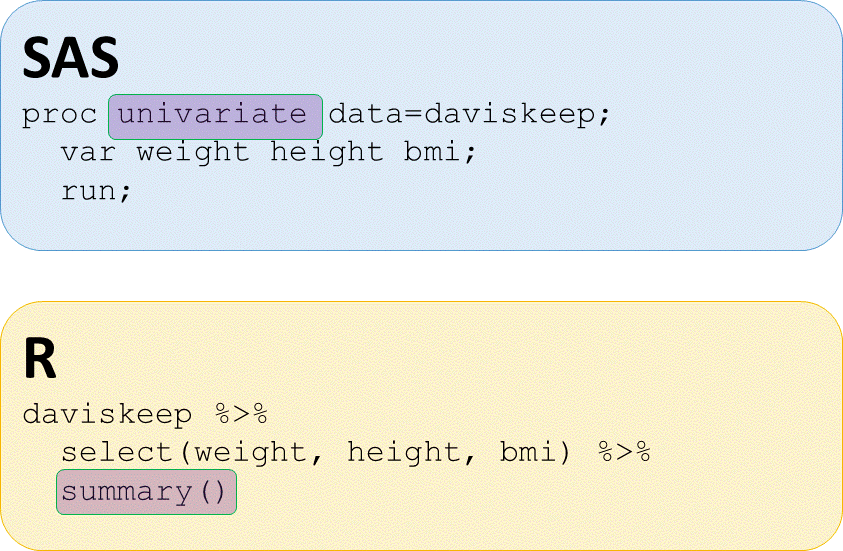
SAS PROC UNIVARIATE와 R의 summary, Hmisc/psych의 describe 비교

SAS 사용자를 위한 R

SAS PROC UNIVARIATE와 R의 summary 함수 비교

SAS 사용자를 위한 R

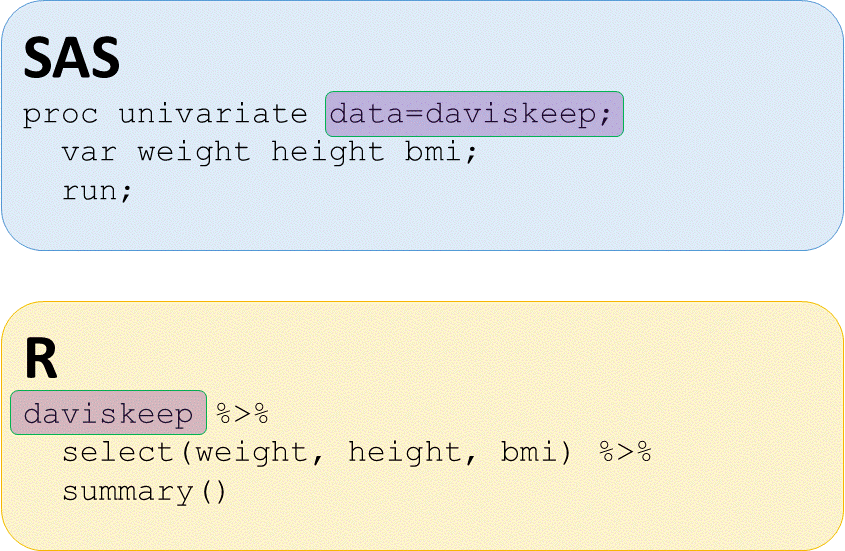
SAS PROC UNIVARIATE와 R 코드의 데이터 정의 비교

SAS 사용자를 위한 R

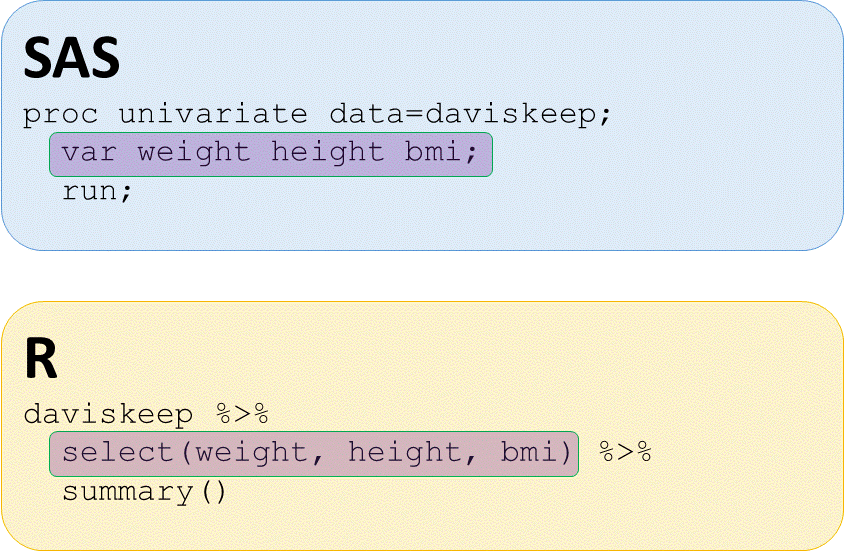
SAS의 VAR 문은 R의 select와 유사

SAS 사용자를 위한 R

요약 통계

# Summary statistics of weight, height, bmi of daviskeep
daviskeep %>%
  select(weight, height, bmi) %>%
  summary()
     weight          height           bmi       
 Min.   : 39.0   Min.   :148.0   Min.   :15.82  
 1st Qu.: 55.0   1st Qu.:164.0   1st Qu.:20.22  
 Median : 63.0   Median :170.0   Median :21.80  
 Mean   : 65.3   Mean   :170.6   Mean   :22.26  
 3rd Qu.: 73.5   3rd Qu.:177.5   3rd Qu.:23.94  
 Max.   :119.0   Max.   :197.0   Max.   :36.73
SAS 사용자를 위한 R

Hmisc로 기술통계

# Load Hmisc, run describe() for sex and bmi
library(Hmisc)
daviskeep %>%
  select(sex, bmi) %>%
  Hmisc::describe()
 2  Variables      199  Observations
-----------------------------------------------------
sex
       n  missing distinct
     199        0        2                       
Value          F     M
Frequency    111    88
Proportion 0.558 0.442

-----------------------------------------------------
bmi
       n  missing distinct     Info     Mean      Gmd
     199        0      176        1    22.26    3.303
     .05      .10      .25      .50      .75      .90
   18.05    18.84    20.22    21.80    23.94    26.30
     .95
   27.25
lowest : 15.82214 16.93703 17.09928 17.43285 17.50639
highest: 29.73704 29.80278 30.09496 30.15916 36.72840
SAS 사용자를 위한 R

psych로 기술통계

# Load psych package, run psych:: describe() for weight, height, bmi
library(psych)
daviskeep %>%
  select(weight, height, bmi) %>%
  psych::describe()

Result

       vars   n   mean    sd median trimmed   mad    min    max range skew kurtosis   se
weight    1 199  65.30 13.34   63.0   64.12 11.86  39.00 119.00 80.00 0.91     0.84 0.95
height    2 199 170.59  8.95  170.0  170.40 10.38 148.00 197.00 49.00 0.21    -0.38 0.63
bmi       3 199  22.26  3.01   21.8   22.08  2.55  15.82  36.73 20.91 0.91     1.91 0.21
SAS 사용자를 위한 R

특정 통계 요약

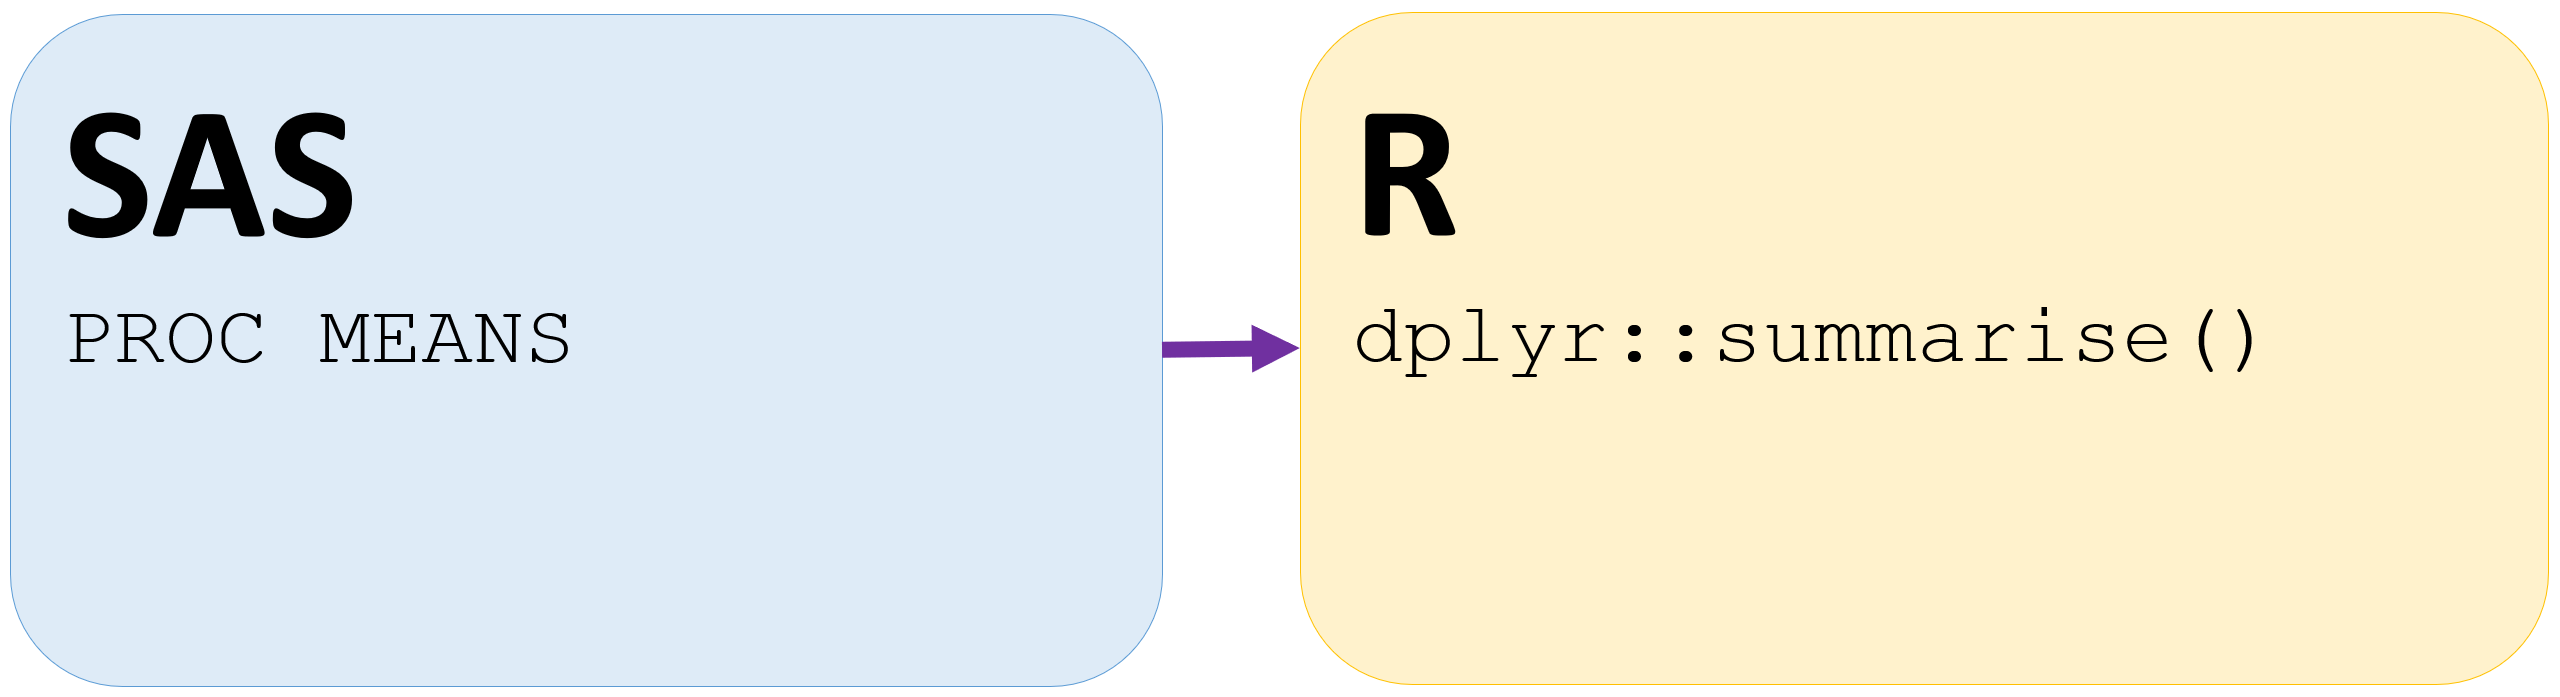
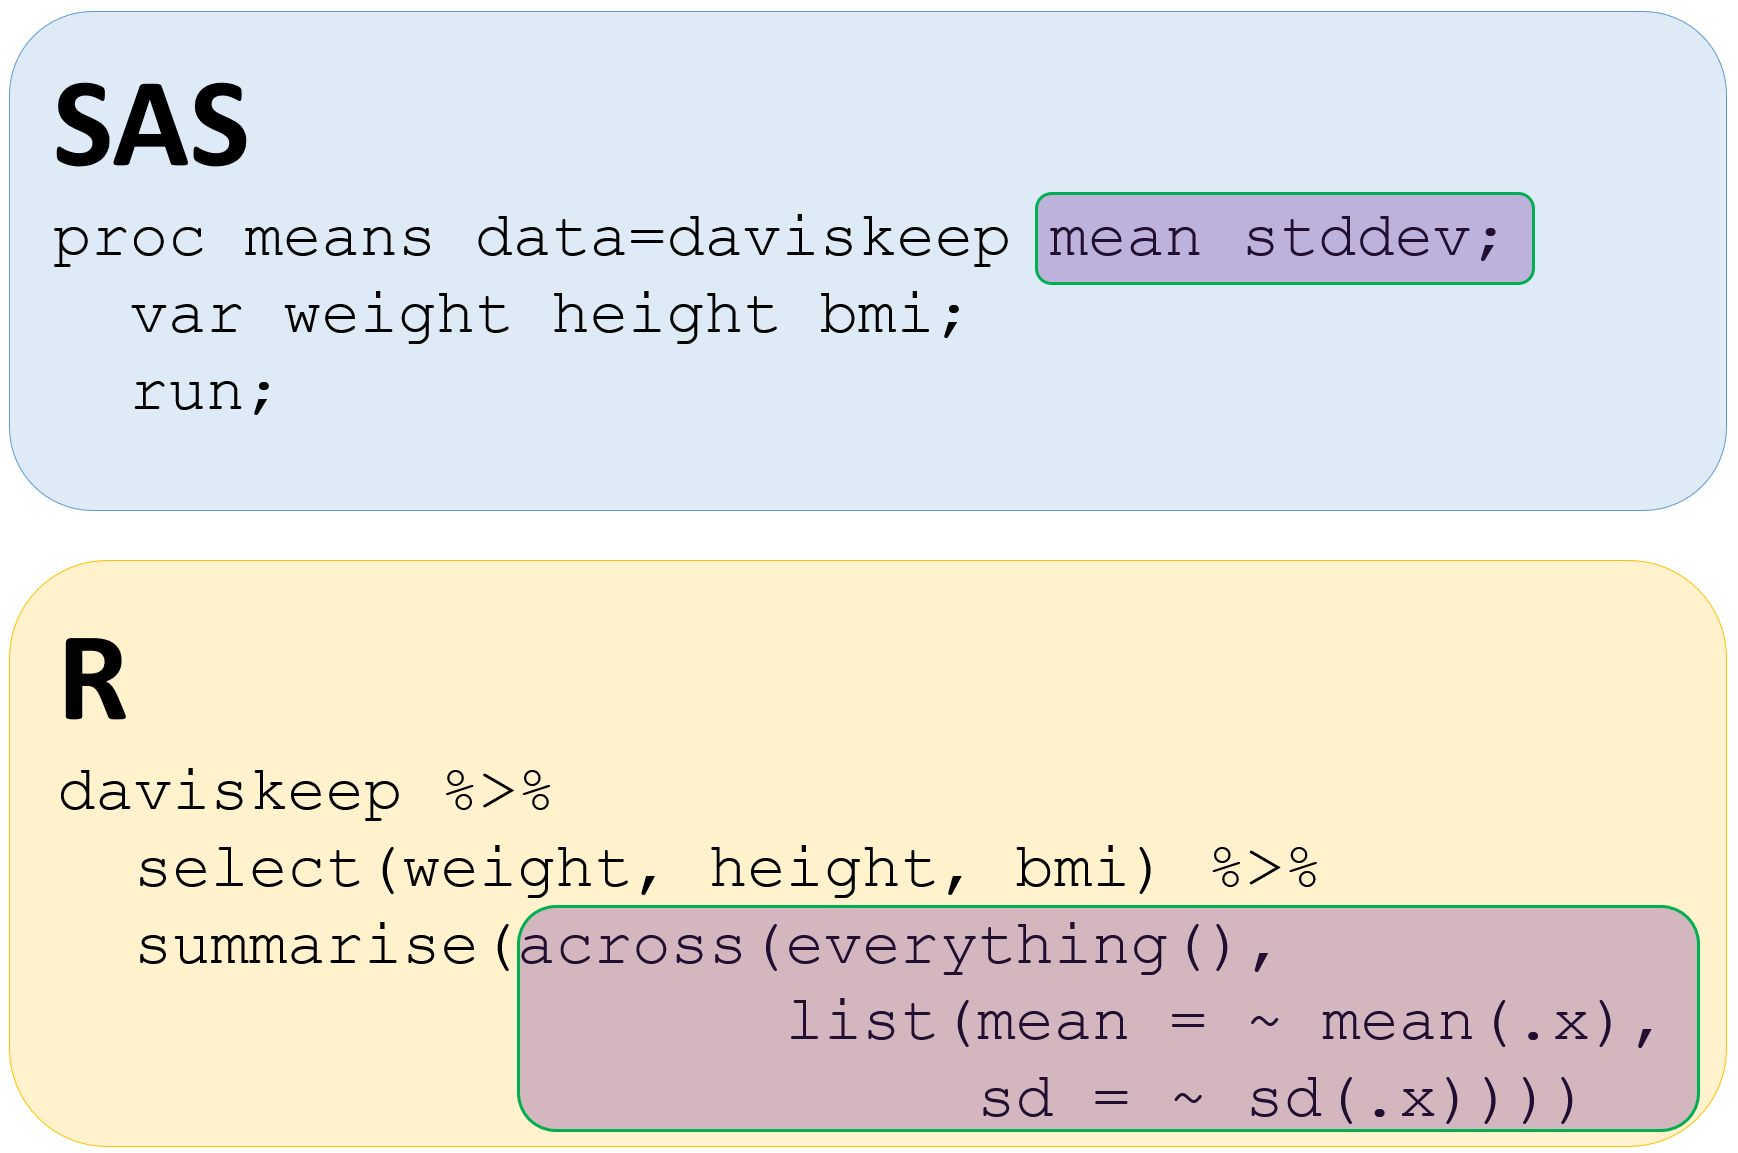
SAS PROC MEANS와 R dplyr의 summarise 비교

1 https://dplyr.tidyverse.org/articles/colwise.html
SAS 사용자를 위한 R

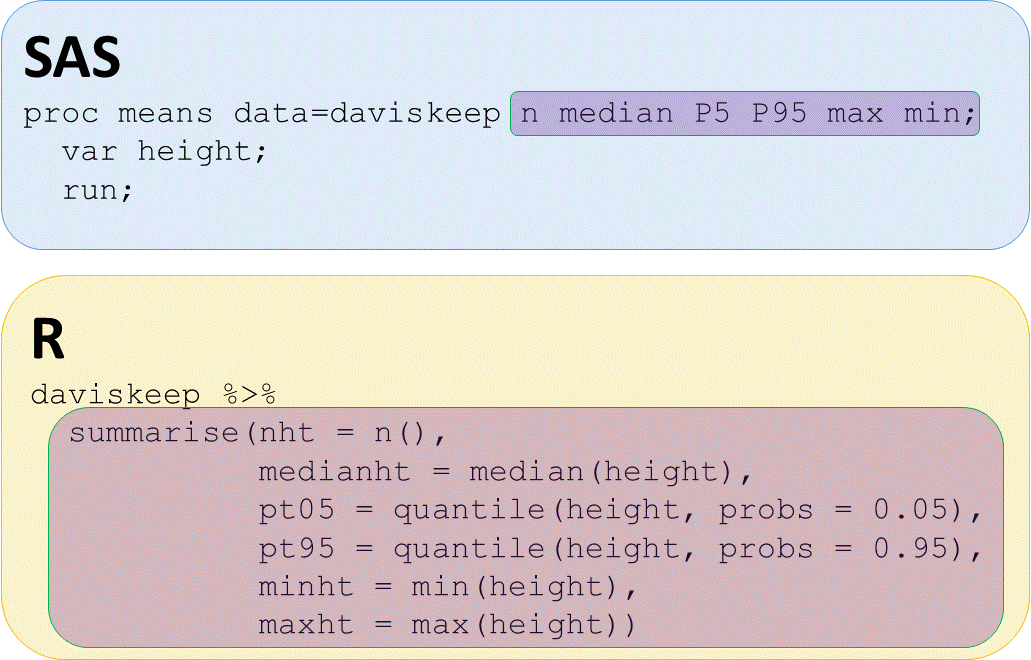
SAS와 R에서 특정 통계 구하기

SAS 사용자를 위한 R

특정 통계 요약 - 단일 변수

# For height, get n, median, 5th, 95th quartiles, min, max
daviskeep %>%
  summarise(nht = n(),
            medianht = median(height),
            pt05 = quantile(height, probs = 0.05),
            pt95 = quantile(height, probs = 0.95),
            minht = min(height),
            maxht = max(height))

Result

  nht medianht pt05 pt95 minht maxht
1 199      170  157  185   148   197
SAS 사용자를 위한 R

SAS PROC MEANS의 특정 통계와 R dplyr summarise의 유사성

1 https://dplyr.tidyverse.org/articles/colwise.html
SAS 사용자를 위한 R

특정 통계 요약 - 다변수

# For weight, height and bmi, get mean, standard deviation
daviskeep %>%
  select(weight, height, bmi) %>%
  summarise(across(everything(), list(mean = ~ mean(.x), 
                                      sd = ~ sd(.x))))

Result

  weight_mean weight_sd height_mean height_sd bmi_mean   bmi_sd
1    65.29648  13.34346    170.5879  8.948848 22.25761 3.009239
SAS 사용자를 위한 R

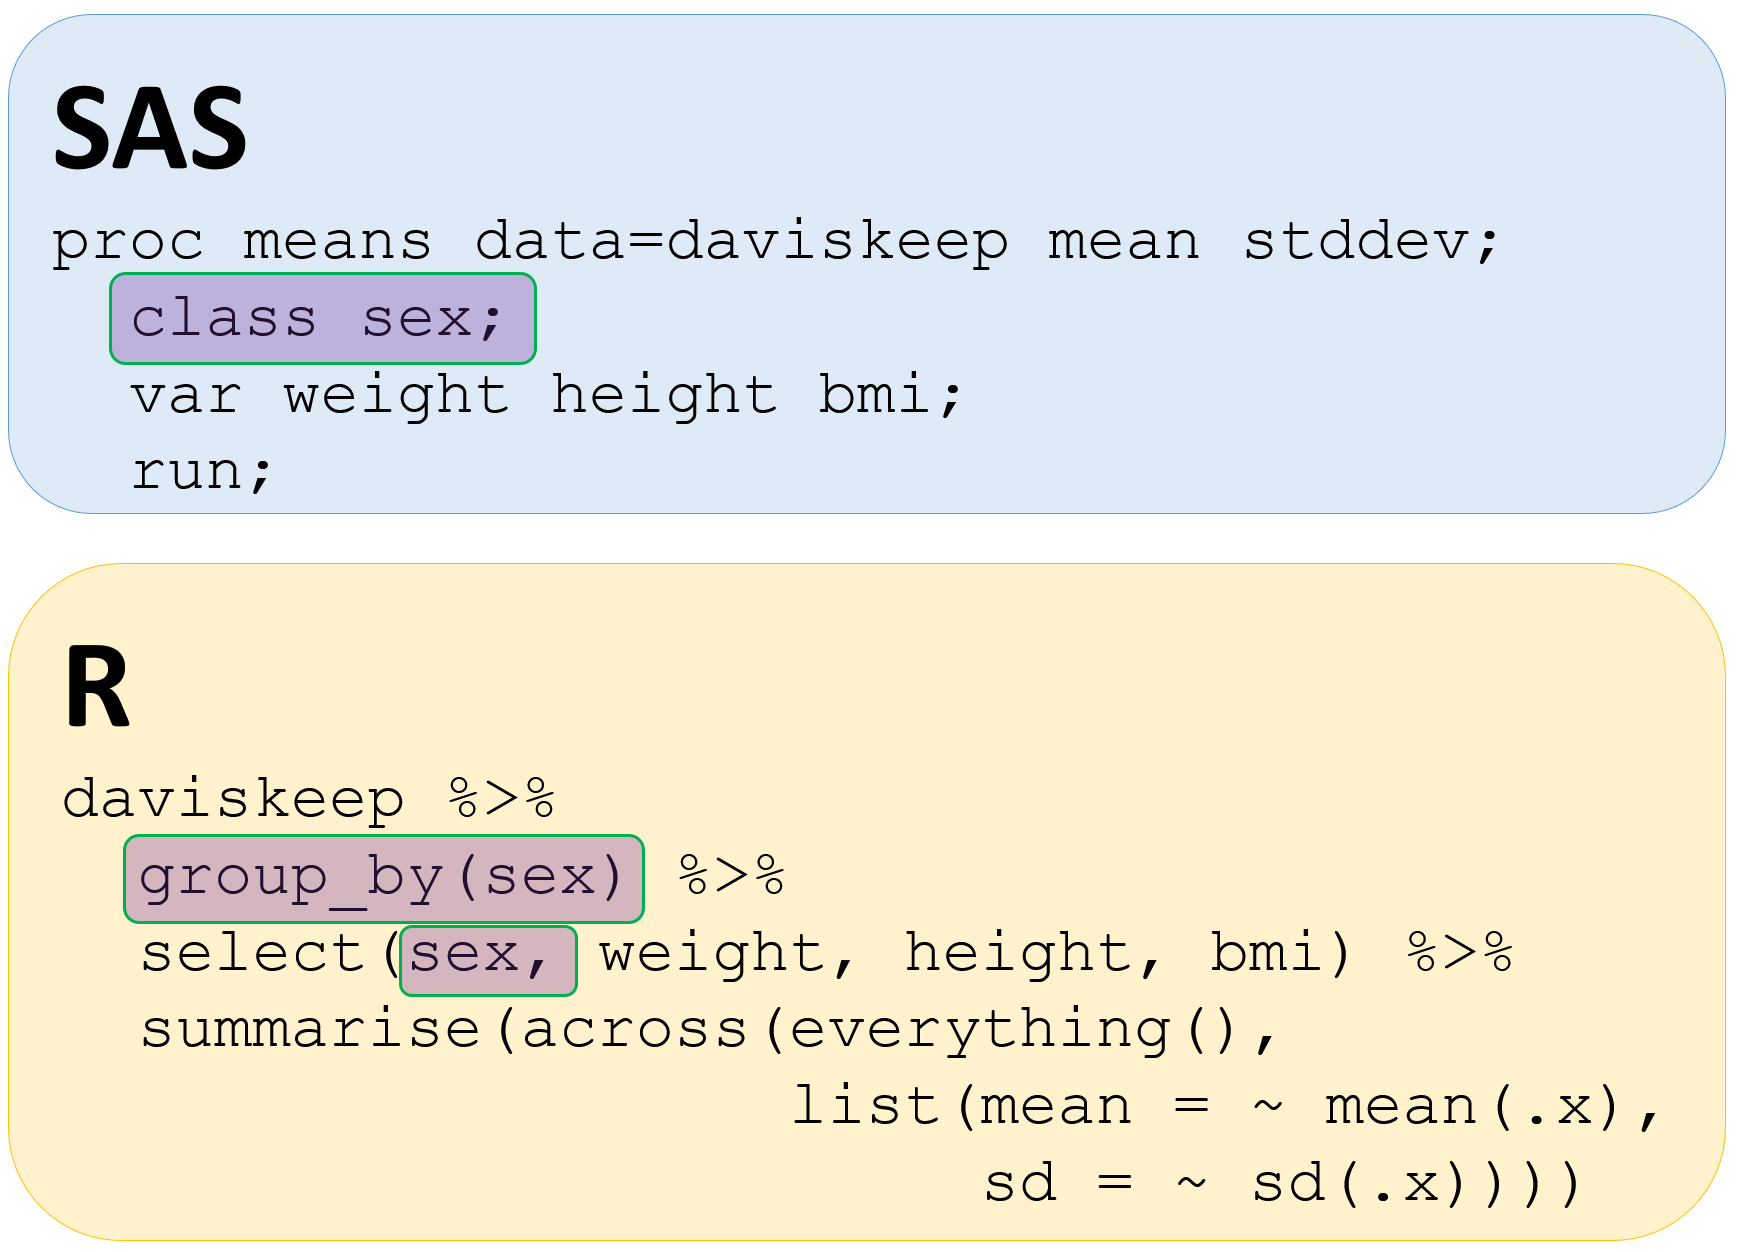
SAS의 CLASS 문은 R의 group_by와 유사

SAS 사용자를 위한 R

요약 통계 - 그룹별

# Get mean and sd for weight, height and bmi by sex group
daviskeep %>%
  group_by(sex) %>%
  select(sex, weight, height, bmi) %>%
  summarise(across(everything(), list(mean = ~ mean(.x), 
                                      sd = ~ sd(.x))))
# A tibble: 2 × 7
  sex   weight_mean weight_sd height_mean height_sd bmi_mean bmi_sd
  <fct>       <dbl>     <dbl>       <dbl>     <dbl>    <dbl>  <dbl>
1 F            56.9      6.89        165.      5.68     21.0   2.18
2 M            75.9     11.9         178.      6.44     23.9   3.12
SAS 사용자를 위한 R

전복 데이터 요약해 봅시다!

SAS 사용자를 위한 R

Preparing Video For Download...