최적화 결과 분석

R로 배우는 중급 포트폴리오 분석

Ross Bennett

Instructor

워크플로: 결과 분석

시각화 데이터 추출
plot() extractObjectiveMeasures()
chart.Concentration() extractStats()
chart.EfficientFrontier() extractWeights()
chart.RiskReward() print()
chart.RiskBudget() summary()
chart.Weights()
R로 배우는 중급 포트폴리오 분석

예시: 가중치 추출

# Extract the optimal weights
extractWeights(opt)
Convertible Arbitrage   CTA Global      Distressed Securities    
         0.000000e+00   6.515184e-02         5.840055e-18                     

Emerging Markets     Equity Market Neutral      Event Driven
  -8.501425e-18           9.348482e-01          4.105887e-18
R로 배우는 중급 포트폴리오 분석

예시: 가중치 추출

head(extractWeights(opt_rebal), n = 3)

         Convertible Arbitrage   CTA Global   Distressed Securities
2001-12-31          0.12986589   0.06849445            0.00000000
2002-12-31          0.08738164   0.08645814            0.00000000
2003-12-31          0.09177469   0.03192720            0.02419038

           Emerging Markets  Equity Market Neutral  Event Driven
2001-12-31     7.113112e-18             0.8016397  -1.608927e-16
2002-12-31    -2.553006e-19             0.8261602  -3.837233e-17
2003-12-31     0.000000e+00             0.8521077   2.991493e-19
R로 배우는 중급 포트폴리오 분석

예시: 가중치 추출

# Extract the optimal weights
extractWeights(opt)
Convertible Arbitrage   CTA Global      Distressed Securities    
         0.000000e+00   6.515184e-02         5.840055e-18                     

Emerging Markets     Equity Market Neutral      Event Driven
  -8.501425e-18           9.348482e-01          4.105887e-18 
R로 배우는 중급 포트폴리오 분석

예시: 가중치 추출

head(extractWeights(opt_rebal), n = 3)
           Convertible Arbitrage CTA Global 
         Convertible Arbitrage   CTA Global   Distressed Securities
2001-12-31          0.12986589   0.06849445            0.00000000
2002-12-31          0.08738164   0.08645814            0.00000000
2003-12-31          0.09177469   0.03192720            0.02419038

           Emerging Markets  Equity Market Neutral  Event Driven
2001-12-31     7.113112e-18             0.8016397  -1.608927e-16
2002-12-31    -2.553006e-19             0.8261602  -3.837233e-17
2003-12-31     0.000000e+00             0.8521077   2.991493e-19
R로 배우는 중급 포트폴리오 분석

예시: 가중치 차트

# Chart the weights
chart.Weights(opt)
chart.Weights(opt_rebal)
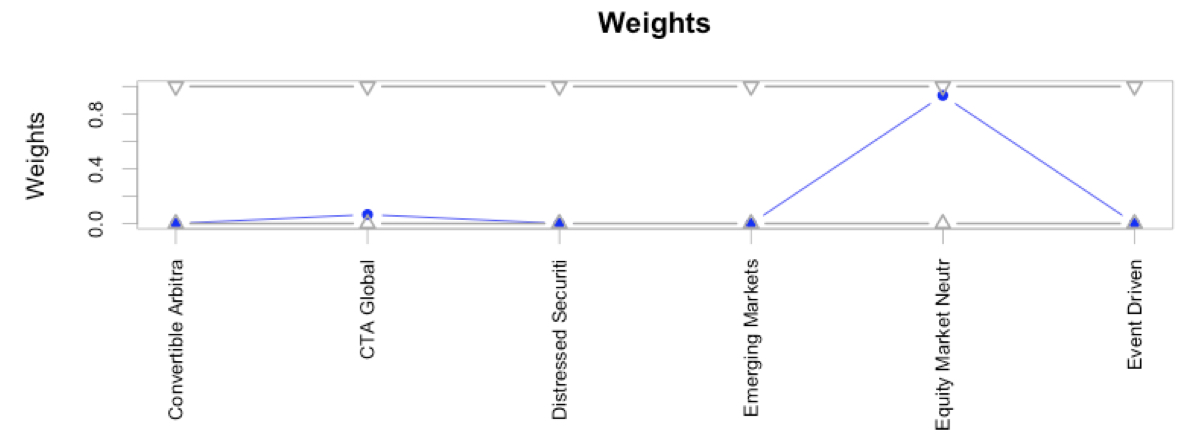
가중치 차트 플롯

R로 배우는 중급 포트폴리오 분석

예시: 가중치 차트

# Chart the weights
chart.Weights(opt)
chart.Weights(opt_rebal)
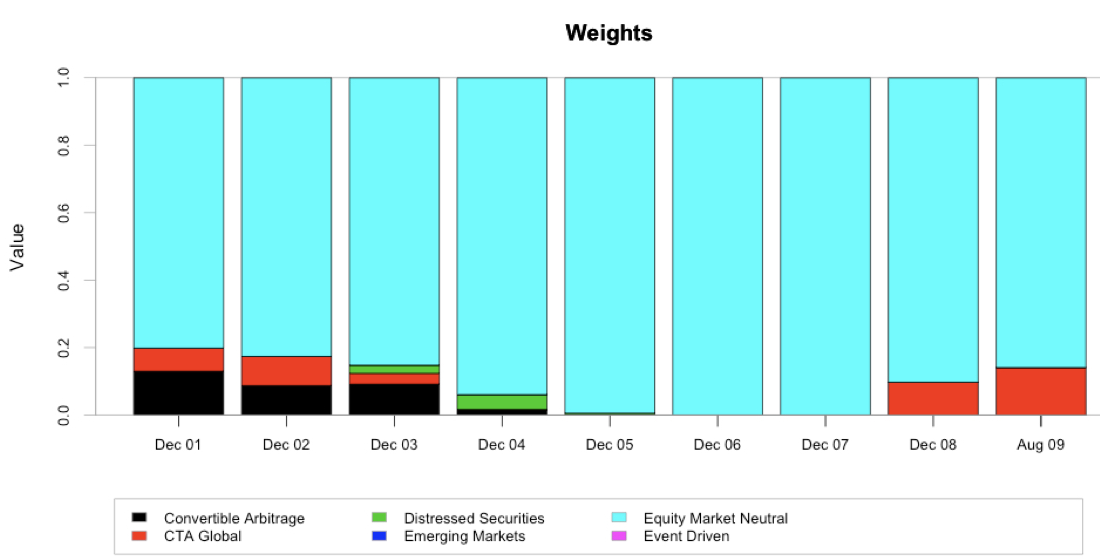
리밸런싱 주기 플롯

R로 배우는 중급 포트폴리오 분석
# Extract the objective measures
extractObjectiveMeasures(opt)
$StdDev
     StdDev 
0.008855401
head(extractObjectiveMeasures(opt_rebal))
                StdDev
2001-12-31 0.006521328
2002-12-31 0.005886103
2003-12-31 0.005656744
2004-12-31 0.005855993
2005-12-31 0.004308911
2006-12-31 0.004198900
R로 배우는 중급 포트폴리오 분석

예시: 최적화 분석

# Compute the rebalancing returns
rr <- Return.portfolio(ret, weights = extractWeights(opt_rebal))
charts.PerformanceSummary(rr)
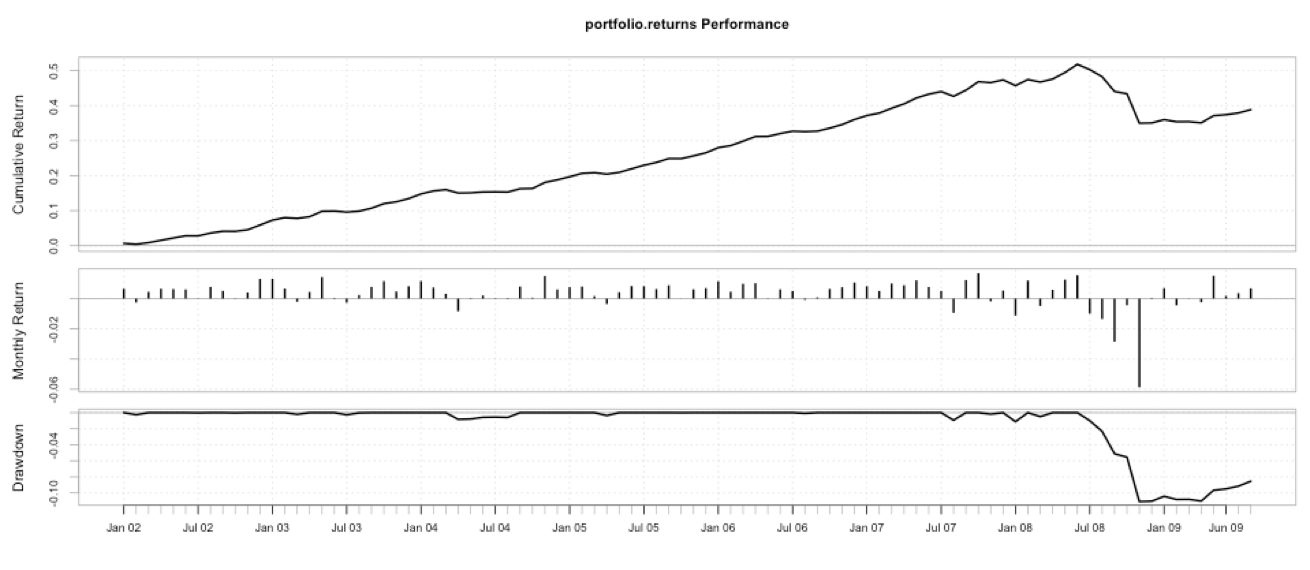
성과 요약 플롯

R로 배우는 중급 포트폴리오 분석

연습해 봅시다!

R로 배우는 중급 포트폴리오 분석

Preparing Video For Download...