R에서의 Support Vector Machine
Kailash Awati
Instructor
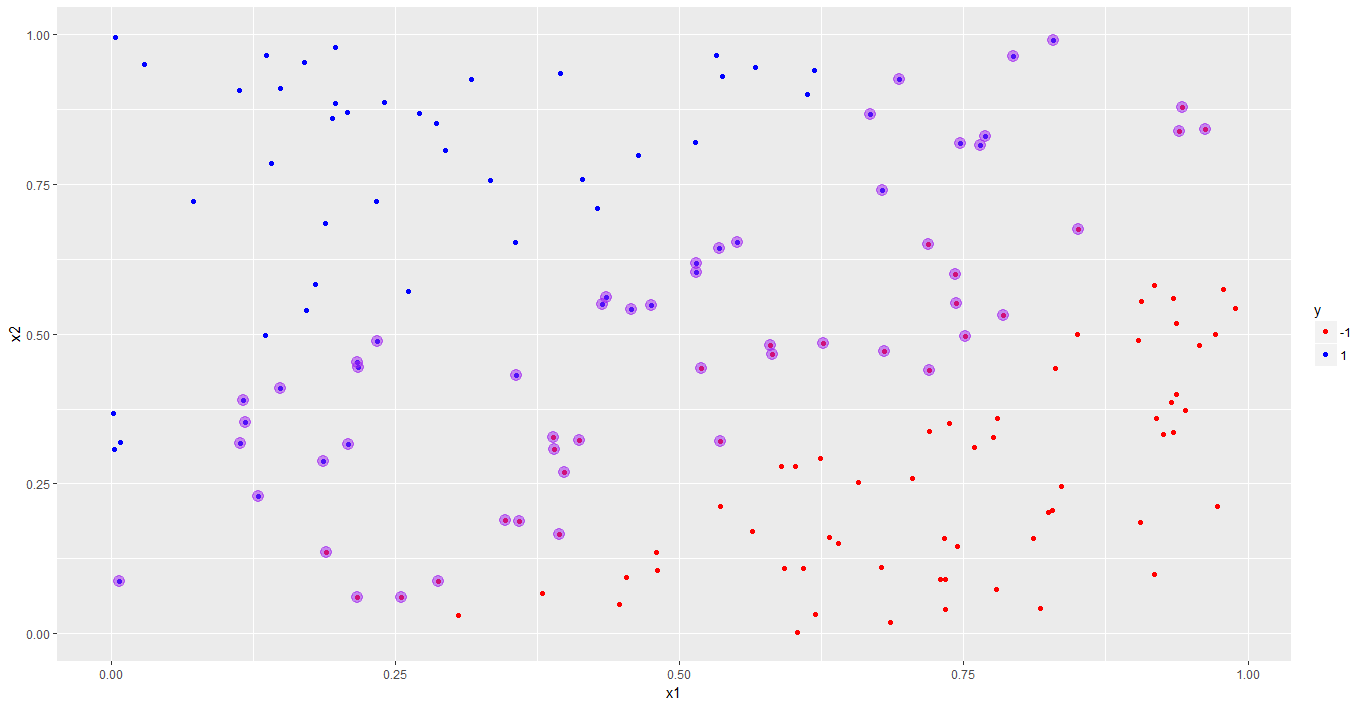
ggplot()으로 훈련 데이터를 시각화합니다.# Visualize training data, distinguish classes using color
p <- ggplot(data = trainset, aes(x = x1, y = x2, color = y)) +
geom_point() +
scale_color_manual(values = c("red", "blue"))
# Render plot
p
svm_model의 index로 서포트 벡터를 표시합니다.# Identify support vectors
df_sv <- trainset[svm_model$index, ]
# Mark out support vectors in plot
p <- p + geom_point(data = df_sv,
aes(x = x1, y = x2),
color = "purple",
size = 4, alpha = 0.5)
# Display plot
p

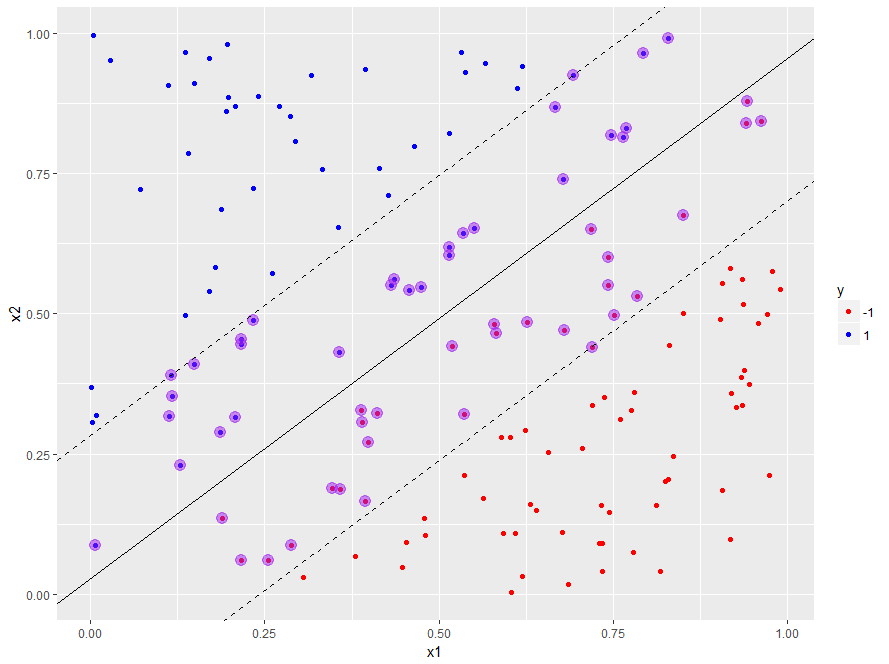
경계의 기울기와 절편 구하기:
svm_model의 coefs와 SV로 가중치 벡터 w 구성.# Build weight vector
w <- t(svm_model$coefs) %*% svm_model$SV
-w[1] / w[2]# Calculate slope and save it to a variable
slope_1 <- -w[1] / w[2]
svm_model$rho / w[2]# Calculate intercept and save it to a variable
intercept_1 <- svm_model$rho / w[2]
geom_abline()을 사용하여 결정 경계를 플롯에 추가합니다.# Plot decision boundary based on calculated slope and intercept
p <- p + geom_abline(slope = slope_1,
intercept = intercept_1)
1 / w[2]만큼 이동합니다.# Add margins to plot
p <- p +
geom_abline(slope = slope_1,
intercept = intercept_1 - 1 / w[2],
linetype = "dashed") +
geom_abline(slope = slope_1,
intercept = intercept_1 + 1 / w[2],
linetype = "dashed")
# Display plot
p

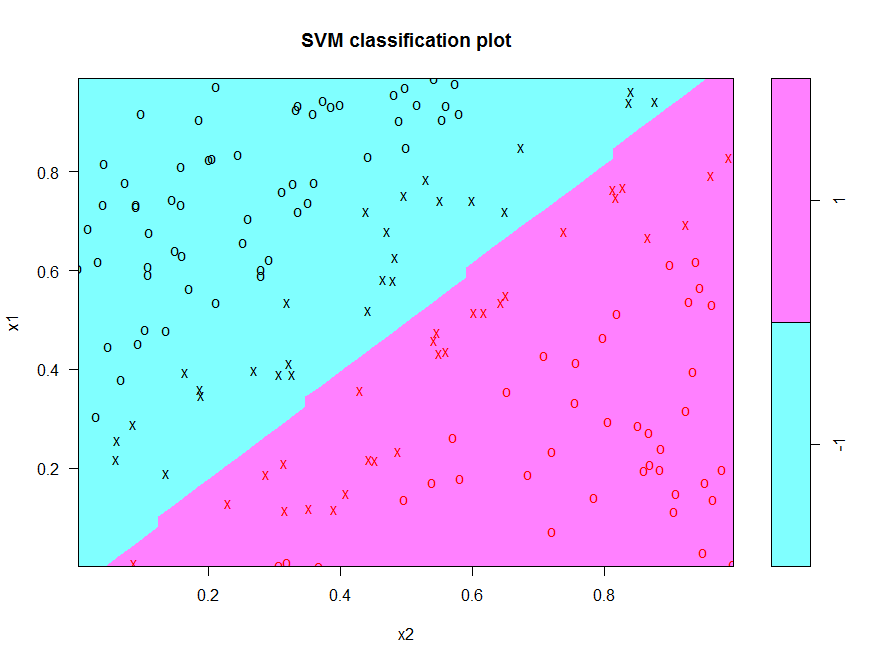
e1071의 plot() 함수를 사용하면 결정 경계를 쉽게 시각화할 수 있습니다.# Visualize decision boundary using built in plot function
plot(x = svm_model,
data = trainset)

R에서의 Support Vector Machine