계절성과 추세

Python으로 IoT 데이터 분석하기

Matthias Voppichler

IT Developer

시계열 구성 요소

  • 추세
  • 계절성
  • 잔차/노이즈
series[t] = trend[t] + seasonal[t] + residual[t]
20.2 = 14.9 + 4.39 + 0.91
Python으로 IoT 데이터 분석하기

계절 분해

import statsmodels.api as sm
# 계절 분해 실행
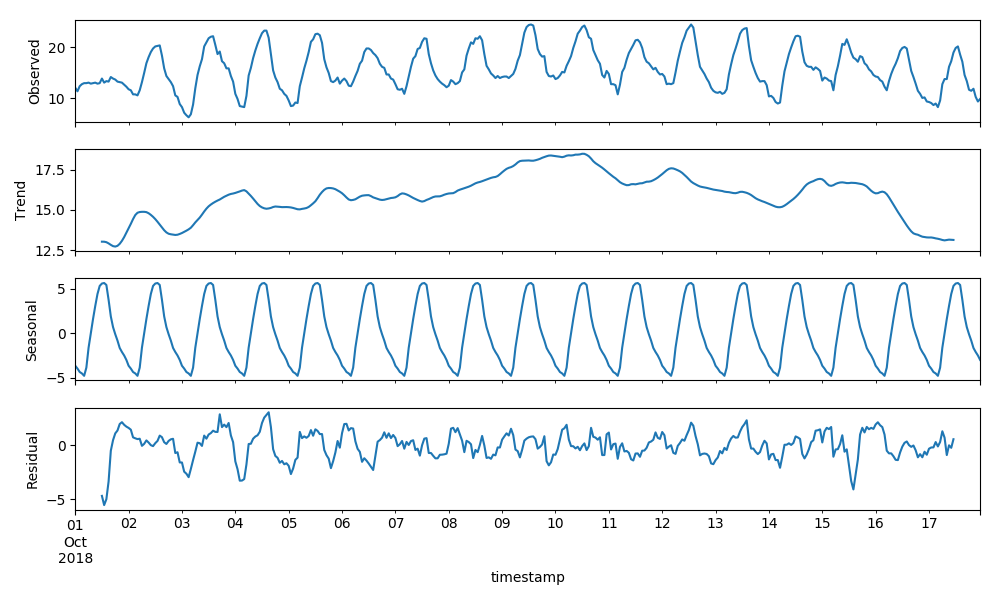
decomp = sm.tsa.seasonal_decompose(data["temperature"])
print(decomp.seasonal.head())

decomp.plot()
timestamp
2018-10-01 00:00:00   -3.670394
2018-10-01 01:00:00   -3.987451
2018-10-01 02:00:00   -4.372217
2018-10-01 03:00:00   -4.534066
2018-10-01 04:00:00   -4.802165
Freq: H, Name: temperature, dtype: float64
Python으로 IoT 데이터 분석하기

계절 분해

계절 분해 플롯

Python으로 IoT 데이터 분석하기

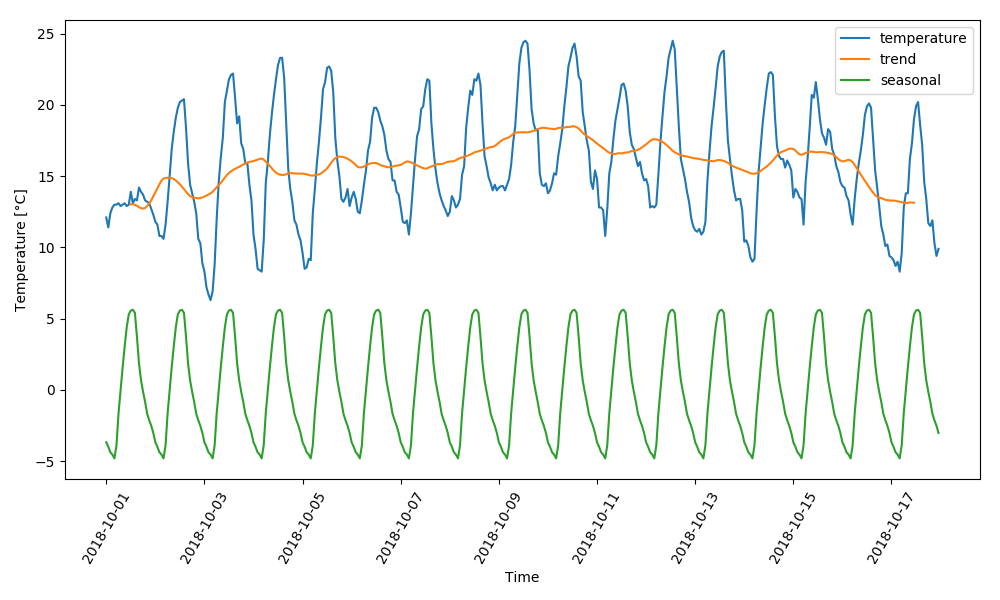
결합 플롯

# 시계열 그리기
plt.plot(data["temperature"], label="temperature")

decomp = sm.tsa.seasonal_decompose(data["temperature"]) # 추세와 계절성 그리기 plt.plot(decomp.trend, label="trend") plt.plot(decomp.seasonal, label="seasonal") plt.show()
Python으로 IoT 데이터 분석하기

결합 플롯

계절 분해 - 결합 플롯

Python으로 IoT 데이터 분석하기

연습해 봅시다!

Python으로 IoT 데이터 분석하기

Preparing Video For Download...