데이터 정제
Python으로 IoT 데이터 분석하기

Matthias Voppichler
IT Developer
결측치
IoT 기기에서 결측치가 생기는 이유
- 불안정한 네트워크 연결
- 전원 부족
- 기타 외부 요인
데이터 품질을 다루는 시점
- 수집 중
- 분석 중
결측치 처리
결측치 처리 방법
- 채우기
- 평균
- 중앙값
- 이전값으로 채우기(Forward-fill)
- 다음값으로 채우기(Backward-fill)
- 삭제
- 분석 중단
결측치 탐지
df.info()
<class 'pandas.core.frame.DataFrame'>
DatetimeIndex: 12 entries, 2018-10-15 08:00:00 to 2018-10-15 08:55:00
Data columns (total 3 columns):
temperature      8 non-null float64
humidity         8 non-null float64
precipitation    12 non-null float64
dtypes: float64(3)
memory usage: 384.0 bytes
결측치 삭제
print(df.head())
                     temperature  humidity  precipitation
timestamp
2018-10-15 08:00:00         16.7      64.2            0.0
2018-10-15 08:05:00         16.6       NaN            0.0
2018-10-15 08:10:00         16.5      65.3            0.0
2018-10-15 08:15:00          NaN      65.0            0.0
2018-10-15 08:20:00         16.8      64.3            0.0
df.dropna()
                     temperature  humidity  precipitation
timestamp
2018-10-15 08:00:00         16.7      64.2            0.0
2018-10-15 08:10:00         16.5      65.3            0.0
2018-10-15 08:20:00         16.8      64.3            0.0
결측치 채우기
df
                     temperature  humidity  precipitation
timestamp
2018-10-15 08:00:00         16.7      64.2            0.0
2018-10-15 08:05:00         16.6       NaN            0.0
2018-10-15 08:10:00         17.0      65.3            0.0
2018-10-15 08:15:00          NaN      65.0            0.0
2018-10-15 08:20:00         16.8      64.3            0.0
df.fillna(method="ffill")
                     temperature  humidity  precipitation
timestamp
2018-10-15 08:00:00         16.7      64.2            0.0
2018-10-15 08:05:00         16.6      64.2            0.0
2018-10-15 08:10:00         17.0      65.3            0.0
2018-10-15 08:15:00         17.0      65.0            0.0
2018-10-15 08:20:00         16.8      64.3            0.0
중단된 측정
print(df.head())
timestamp            temperature  humidity
2018-10-15 00:00:00         13.5      84.7
2018-10-15 00:10:00         13.3      85.6
2018-10-15 00:20:00         12.9      88.8
2018-10-15 00:30:00         12.8      89.2
2018-10-15 00:40:00         13.0      87.7
print(df.isna().sum())
temperature    0
humidity       0
dtype: int64
df_res = df.resample("10min").last()
print(df_res.head())
timestamp            temperature  humidity
2018-10-15 00:00:00         13.5      84.7
2018-10-15 00:10:00         13.3      85.6
2018-10-15 00:20:00         12.9      88.8
2018-10-15 00:30:00         12.8      89.2
2018-10-15 00:40:00         13.0      87.7
print(df_res.isna().sum())
temperature    34
humidity       34
dtype: int64
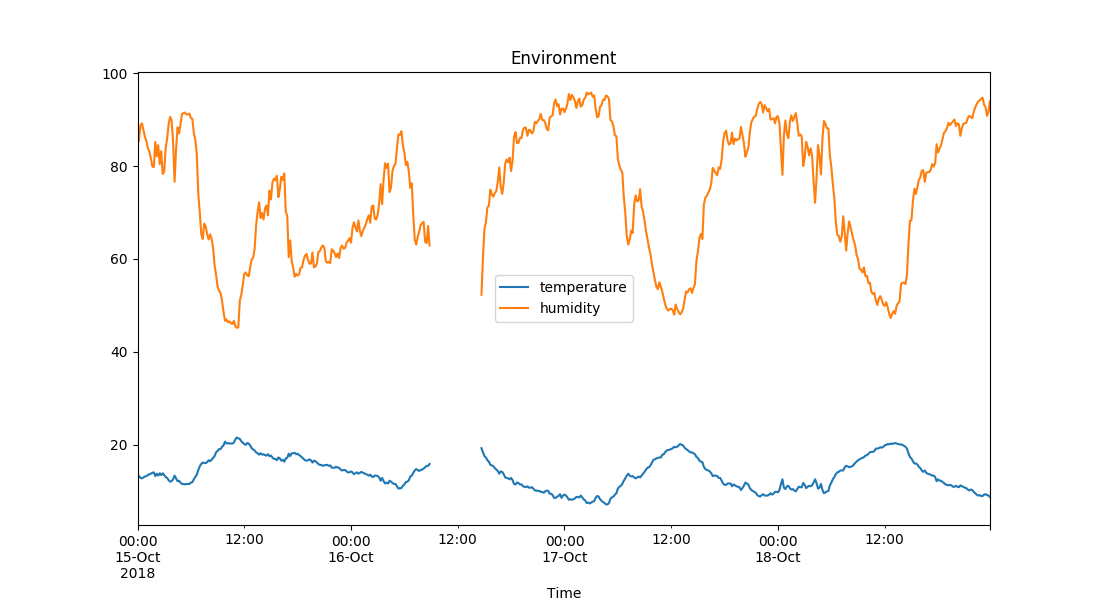
중단된 측정
df_res.plot(title="Environment")
연습해 봅시다!
Python으로 IoT 데이터 분석하기

