트위터 네트워크 시각화

R로 소셜 미디어 데이터 분석하기

Sowmya Vivek

Data Science Coach

학습 개요

  • 기본 매개변수로 네트워크 플롯 그리기
  • 가독성을 높이기 위한 서식 속성 적용
  • 중심성과 속성으로 플롯 강화
R로 소셜 미디어 데이터 분석하기

리트윗 네트워크 확인

# View the retweet network
print.igraph(nw_rtweet)
IGRAPH e7e618c DN-- 21 39 -- 
+ attr: name (v/c), followers (v/c)
+ edges from e7e618c (vertex names):
 [1] w3daily    ->RealFirstBuzz   w3daily    ->RealFirstBuzz  
 [3] w3daily    ->Giasaysthat     w3daily    ->RealFirstBuzz  
 [5] VanesEtim  ->PotionVanity    VanesEtim  ->DAVIDxCGN      
 [7] VanesEtim  ->PotionVanity    VanesEtim  ->Avinash_galaxy 
 [9] VanesEtim  ->PotionVanity    VanesEtim  ->BklynLeague    
[11] RedNileShop->Macaw_Blink     RedNileShop->leuqimcouture  
[13] RedNileShop->StoreDiv        RedNileShop->PotionVanity   
[15] RedNileShop->SCISSORSAPPAREL RedNileShop->Themoon12961958
+ ... omitted several edges
R로 소셜 미디어 데이터 분석하기

기본 네트워크 플롯 만들기

# Create the base network plot
set.seed(1234)  
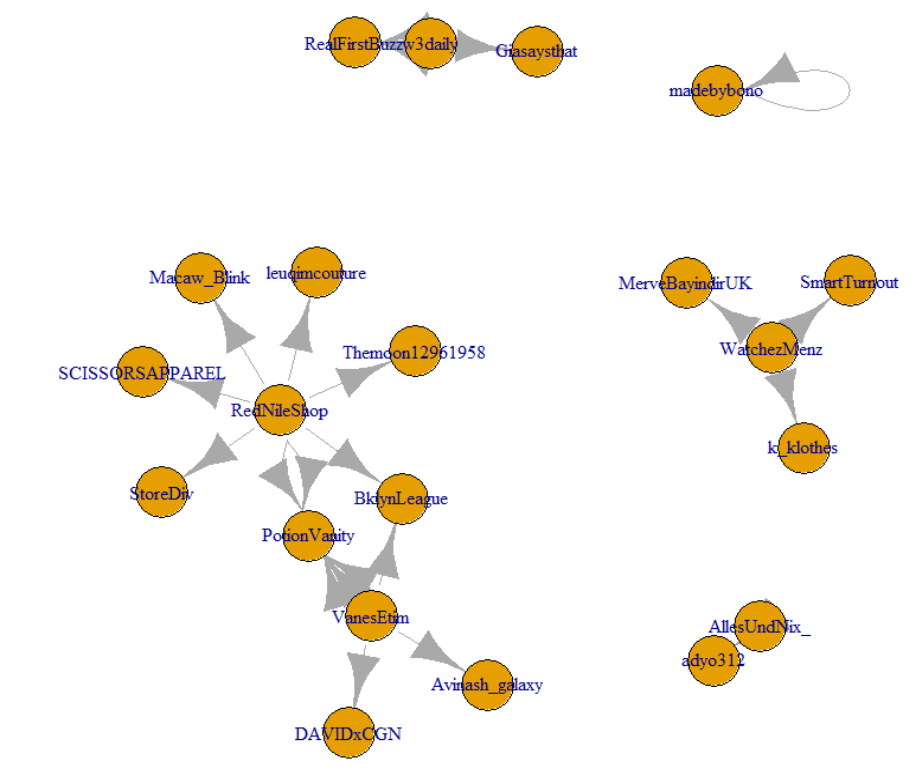
plot.igraph(nw_rtweet)
R로 소셜 미디어 데이터 분석하기

기본 네트워크 플롯 보기

기본 네트워크 플롯

R로 소셜 미디어 데이터 분석하기

플롯 서식 지정

# Format the network plot with attributes
set.seed(1234)
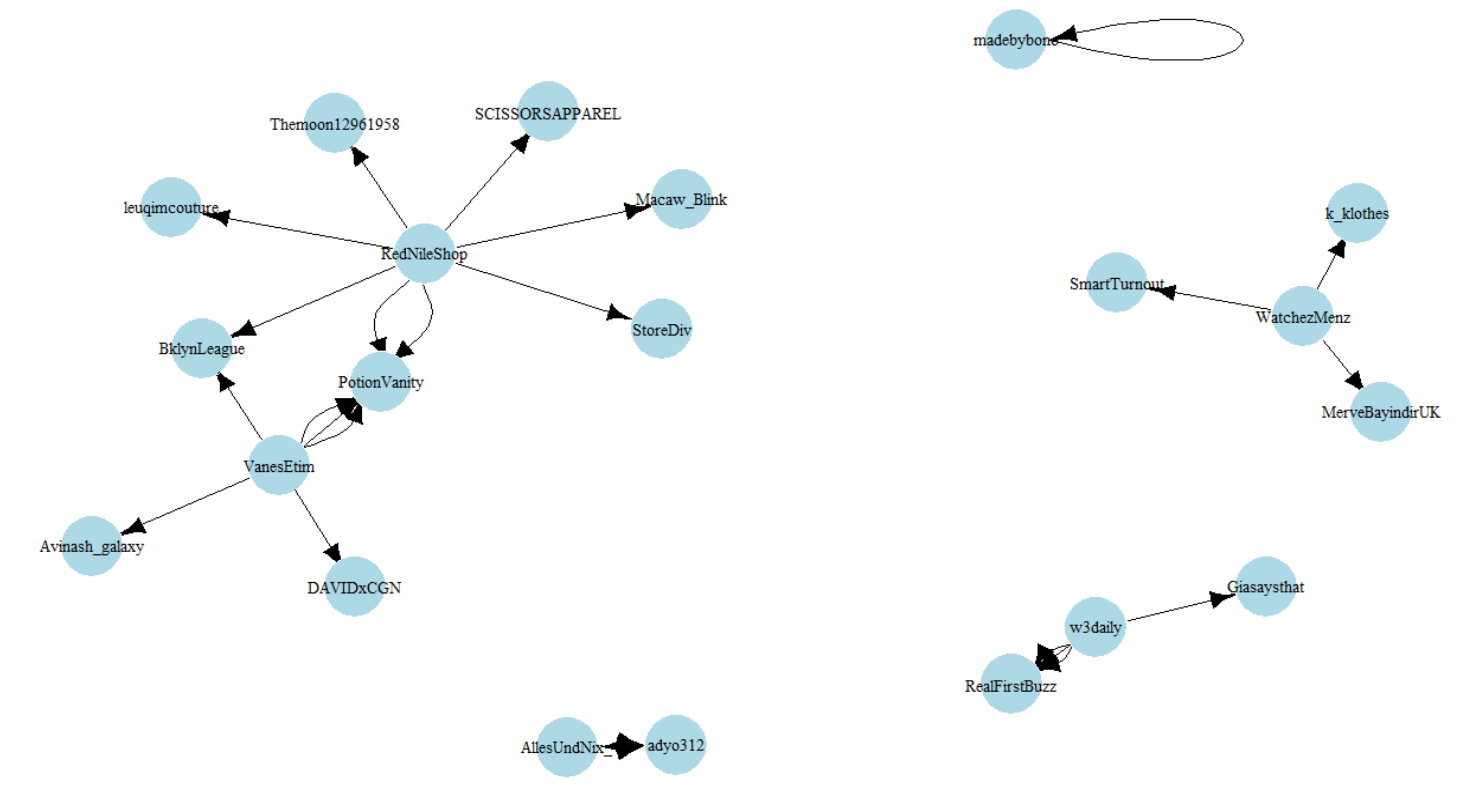
plot(nw_rtweet, asp = 9/16, 
     vertex.size = 10,
     vertex.color = "lightblue",
     edge.arrow.size = 0.5,
     edge.color = "black",
     vertex.label.cex = 0.9,
     vertex.label.color = "black")
R로 소셜 미디어 데이터 분석하기

서식이 적용된 플롯 보기

서식이 적용된 네트워크 플롯

R로 소셜 미디어 데이터 분석하기

아웃디그리로 정점 크기 설정

# Create a variable for out-degree
deg_out <- degree(nw_rtweet, mode = c("out"))
deg_out
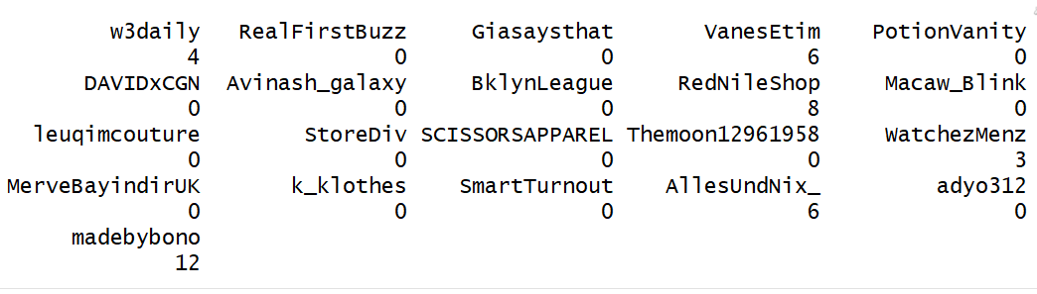
아웃디그리 값

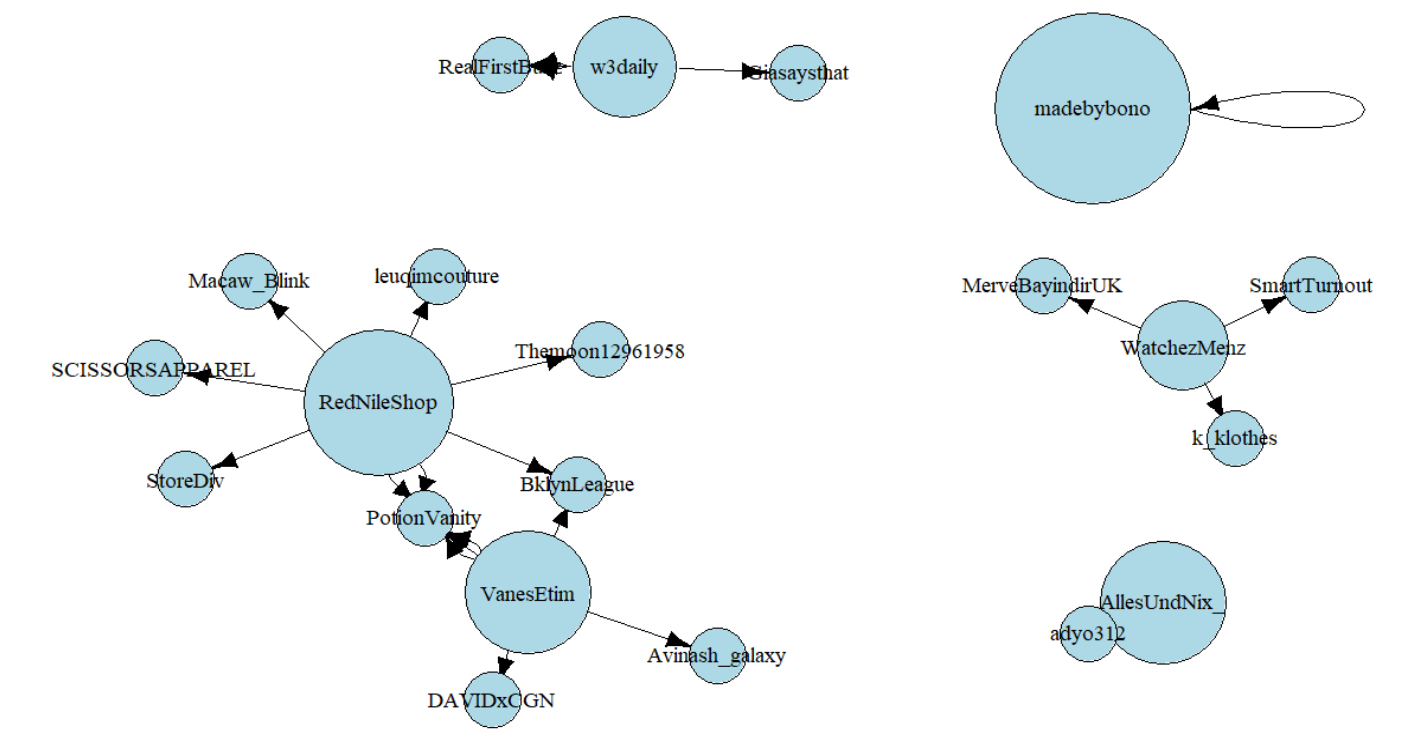
vert_size <- (deg_out * 2) + 10
R로 소셜 미디어 데이터 분석하기

정점 크기 속성에 vert_size 할당

# Assign vert_size to vertex size attribute and plot network
set.seed(1234)
plot(nw_rtweet, asp = 9/16, 
     vertex.size = vert_size,
     vertex.color = "lightblue", 
     edge.arrow.size = 0.5,
     edge.color = "black",
          vertex.label.cex = 1.2,
     vertex.label.color = "black")
R로 소셜 미디어 데이터 분석하기

새 속성이 적용된 플롯 보기

vert_size 속성을 적용한 플롯

R로 소셜 미디어 데이터 분석하기

네트워크 속성 추가

  • 리트윗이 많고 팔로워가 높은 사용자가 더 큰 영향
  • 리트윗·팔로워 수 기반 네트워크 플롯
  • 팔로워 수를 네트워크 속성으로 추가
R로 소셜 미디어 데이터 분석하기

네트워크 사용자 팔로워 수

# Import the followers count data frame
followers <- readRDS("follower_count.rds")
R로 소셜 미디어 데이터 분석하기

팔로워 데이터 프레임 보기

# View the follower count
head(followers)
screen_name    followers_count
<fct>             <dbl>
adyo312            58        
AllesUndNix_       18        
Avinash_galaxy     1536        
BklynLeague        40        
DAVIDxCGN          267        
Giasaysthat        9139
R로 소셜 미디어 데이터 분석하기

네트워크 사용자 팔로워 수

# Categorize high and low follower count
followers$follow <- ifelse(followers$followers_count > 500, "1", "0")
R로 소셜 미디어 데이터 분석하기

팔로워 데이터 프레임 보기

# View the data frame with the new column
head(followers)
screen_name    followers_count    follow
<fct>              <dbl>          <chr>
adyo312              58              0    
AllesUndNix_         18              0    
Avinash_galaxy     1536              1    
BklynLeague          40              0    
DAVIDxCGN           267              0    
Giasaysthat        9139              1
R로 소셜 미디어 데이터 분석하기

네트워크 속성 할당

# Assign external network attributes to retweet network
V(nw_rtweet)$followers <- followers$follow
R로 소셜 미디어 데이터 분석하기

정점 속성 보기

# View the vertex attributes
vertex_attr(nw_rtweet)
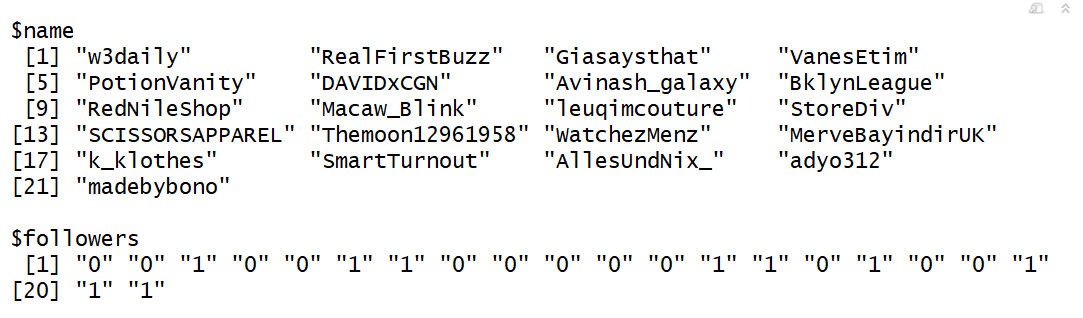
정점 속성

R로 소셜 미디어 데이터 분석하기

정점 색상 변경

# Set the vertex colors for the plot
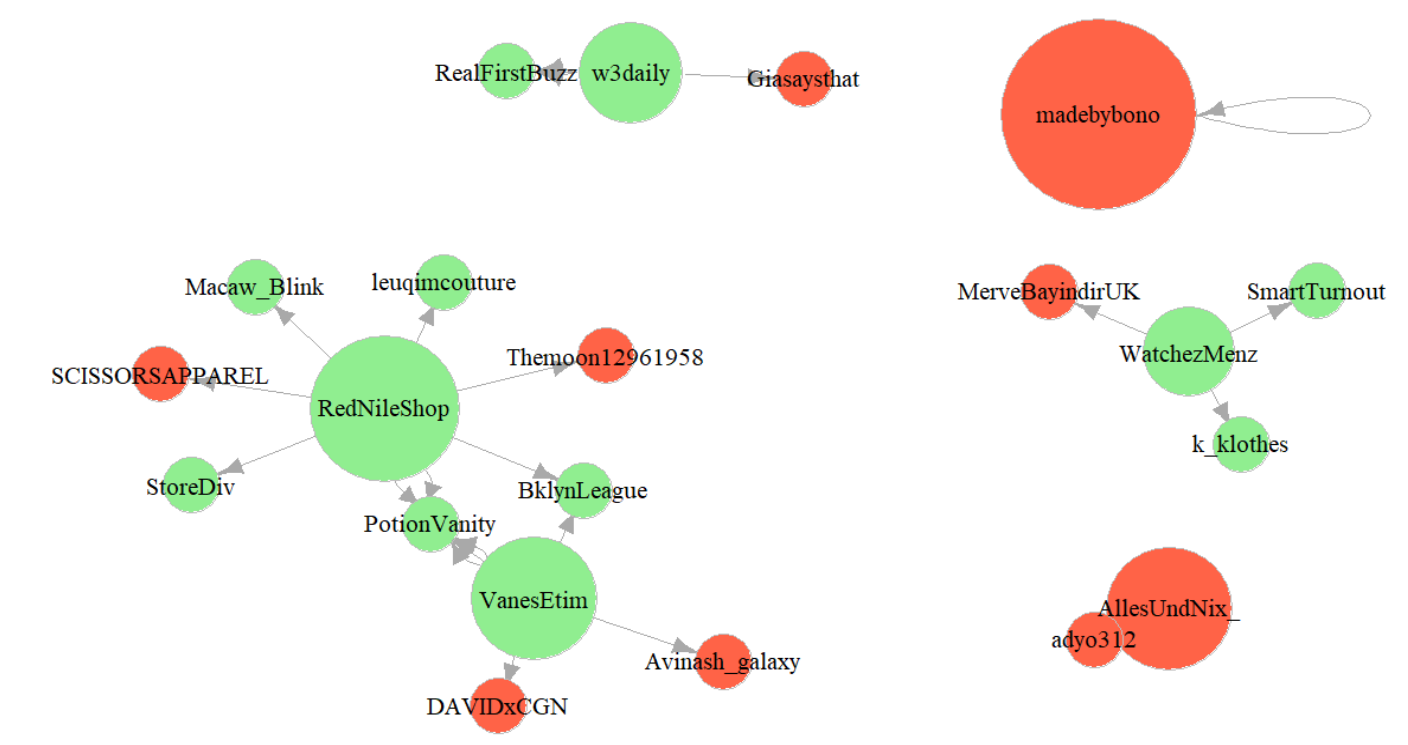
sub_color <- c("lightgreen", "tomato")
set.seed(1234)
plot(nw_rtweet, asp = 9/16,
     vertex.size = vert_size,
     edge.arrow.size = 0.5,
     vertex.label.cex = 1.3,
     vertex.color = sub_color[as.factor(vertex_attr(nw_rtweet, "followers"))],
     vertex.label.color = "black",
     vertex.frame.color = "grey")
R로 소셜 미디어 데이터 분석하기

정점 속성으로 서식화된 플롯 보기

정점 속성 기반 플롯

R로 소셜 미디어 데이터 분석하기

연습해 봅시다!

R로 소셜 미디어 데이터 분석하기

Preparing Video For Download...