Python으로 설문 데이터 분석하기
EbunOluwa Andrew
Data Scientist

출력 변수와 관련 있는 입력 변수 선정
변수들이 모집단에 미치는 영향 파악
차이가 우연인지 통계적으로 유의한지 확인

| pet_type | current_pets | time_spent | reduces_stress |
|---|---|---|---|
| dog | 1 | 420 | yes |
| dog | 1 | 180 | yes |
| dog | 4 | 30 | yes |
| dog | 1 | 30 | yes |
| dog | 1 | 60 | yes |
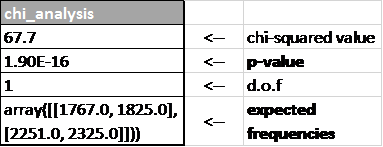
pet_typereduces_stressimport pandas as pd import scipy.stats as st data = pd.read_csv('pet_survey.csv')cross_table = pd.crosstab(data.reduces_stress, data.pet_type)chi_analysis = st.chi2_contingency(cross_table)print(chi_analysis)
|--------------------------|
| (67.7, |
| 1.9e-16, |
| 1, |
| array([[1767.0, 1825.0], |
| [2251.0, 2325.0]])) |
도수 >= 5
p-값 < 0.05
pet_owned와 reduces_stress는 관련 있음반려동물 유형은 스트레스 감소 인식에 영향을 줌

Python으로 설문 데이터 분석하기