통계적 모델링 기법

Python으로 설문 데이터 분석하기

EbunOluwa Andrew

Data Scientist

왜 설문 분석에서 통계적 모델링을 쓰나요?

  • 변수 간 관계로 예측 수행
  • 시각화를 활용
    • 인사이트를 선명하게 전달

Chris Liverani, Unsplash - 스마트폰과 모니터

1 이미지: Chris Liverani, Unsplash
Python으로 설문 데이터 분석하기

통계적 모델링을 언제 사용하나요

  • 복잡한 데이터
  • 변수 간 영향 파악
  • 결과 예측

Tyler Easton, Unsplash - 벽에 인쇄된 숫자들

1 이미지: Tyler Easton, Unsplash
Python으로 설문 데이터 분석하기

통계적 모델링 기법 예시

  • 선형 회귀
  • 두 표본 t-검정
  • 카이제곱 검정

Алекс Арцибашев, Unsplash - 상승하는 막대 블록

Python으로 설문 데이터 분석하기

선형 회귀 모형

  • 선형 회귀 모형
    • x와 y 간 선형 관계 가정
    • y = m*x + b
    • y = 종속 변수
    • x = 독립 변수
    • m = 기울기
    • b = y절편

Seeing Theory-Brown.edu 이미지 - 점들 사이 최적 적합선

1 이미지: Seeing Theory-Brown.edu
Python으로 설문 데이터 분석하기

설문 분석의 선형 회귀

employee gender company_type wfh_available mental_fatigue_score burn_rate
fff200 Male Service No 3 0.24
fff500 Female Service Yes 5.7 0.45
fff700 Female Service Yes 5.8 0.49
fff300 Female Service Yes 6.7 0.63
fff100 Female Product Yes 4.7 0.38
fff400 Male Service Yes 3.4 0.28
fff600 Female Product Yes 5.4 0.5
fffe3400 Female Product No 6.7 0.58
fffe200 Male Service Yes 6.3 0.48
fffe3000 Male Service Yes 5.4 0.41
Python으로 설문 데이터 분석하기

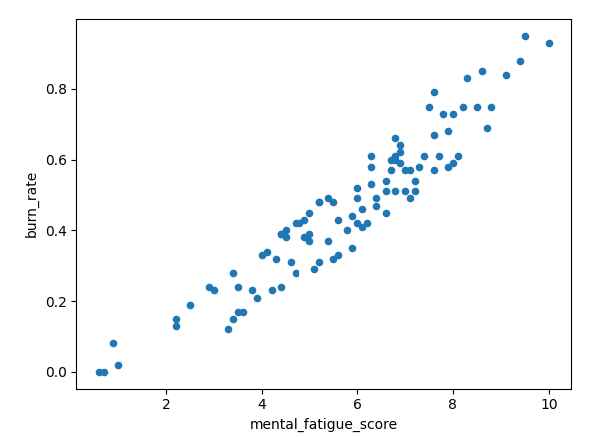
설문 분석의 선형 회귀

data.plot.scatter(
x='mental_fatigue_score',
y='burn_rate')
plt.show()

burn_rate 대 mental_fatigue_score

Python으로 설문 데이터 분석하기

두 표본 t-검정

  • 두 모집단 평균 차이의 유의성 검정
  • 귀무가설 = 두 모집단 평균은 같다
  • 대립가설 = 두 모집단 평균은 같지 않다

Olesia Bahrii, Unsplash - 포도 두 송이

1 이미지: Olesia Bahrii, Unsplash
Python으로 설문 데이터 분석하기

설문 분석의 두 표본 t-검정

employee gender company_type wfh_available mental_fatigue_score burn_rate
fff100 Female Product Yes 4.7 0.38
fff400 Male Service Yes 3.4 0.28
fff600 Female Product Yes 5.4 0.5
company_type burn_rate
Service 0.57
Service 0.75
Service 0.51
Service 0.57
company_type burn_rate
Product 0.51
Product 0.79
Product 0.66
Product 0.39
Python으로 설문 데이터 분석하기

카이제곱 검정

  • 두 범주형 변수 간 연관성의 유의성 검정
  • 귀무가설 = 변수 간 유의한 연관성 없음
  • 대립가설 = 유의한 연관성 있음
Python으로 설문 데이터 분석하기

설문 분석의 카이제곱 검정

  • 변수 #1

    • company_type
    • Product 또는 Service
  • 변수 #2

    • wfh_available
    • Yes 또는 No
company_type wfh_available
Product Yes
Product Yes
Product No
Service Yes
Service Yes
Product Yes
Service No
Service No
Product Yes
Service Yes
Python으로 설문 데이터 분석하기

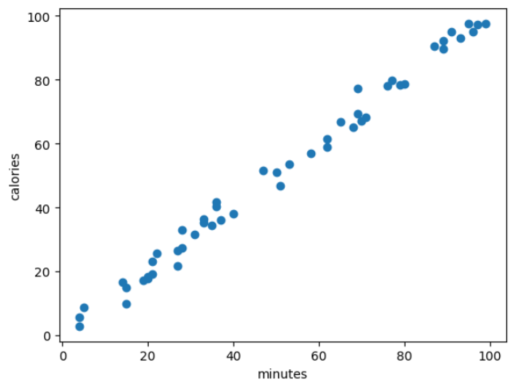
어떤 기법을 쓸까? - 선형 회귀

두 변수 = 수치형

칼로리 대 시간 산점도

Python으로 설문 데이터 분석하기

어떤 기법을 쓸까? - 두 표본 t-검정

  • 두 표본 t-검정
    • 한 변수 = 범주형
    • 한 변수 = 수치형

Diana Polekhina, Unsplash - 노란 배경 위 줄자

1 이미지: Diana Polekhina, Unsplash
Python으로 설문 데이터 분석하기

어떤 기법을 쓸까? - 카이제곱 검정

  • 카이제곱 검정
    • 두 변수 = 범주형

Element5 Digital, Unsplash - 투표 실루엣

1 이미지: Element5 Digital, Unsplash
Python으로 설문 데이터 분석하기

연습해 봅시다!

Python으로 설문 데이터 분석하기

Preparing Video For Download...