DataFrame 소개
MATLAB 사용자를 위한 Python

Justin Kiggins
Product Manager
DataFrame
pandas패키지- 표 형식 데이터
- pandas DataFrame = MATLAB table
- 각 관측치가 혼합형을 가질 수 있는 저장소:
- float
- integer
- Boolean
- string
DataFrame
                     rank num_households frac_dog_owners frac_cat_owners
state
Alabama              17   1828000        0.441           0.274
Arizona              18   2515000        0.401           0.296
Arkansas             6    1148000        0.479           0.306
California           40   12974000       0.328           0.283
Colorado             13   1986000        0.425           0.323
Connecticut          33   1337000        0.283           0.319
Delaware             25   334000         0.337           0.337
District of Columbia 48   287000         0.131           0.116
Florida              32   7609000        0.357           0.273
Georgia              31   3798000        0.401           0.273
.head() 메서드
pets.head()
            rank  num_households  frac_dog_owners  frac_cat_owners
state
Alabama       17         1828000            0.441            0.274
Arizona       18         2515000            0.401            0.296
Arkansas       6         1148000            0.479            0.306
California    40        12974000            0.328            0.283
Colorado      13         1986000            0.425            0.323
.columns 속성
pets.columns
Index(['rank', 'num_households', 'frac_dog_owners', 'frac_cat_owners'],
      dtype='object')
.index 속성
pets.index
Index(['Alabama', 'Arizona', 'Arkansas', 'California', 'Colorado',
       'Connecticut', 'Delaware', 'District of Columbia', 'Florida',
       'Georgia', 'Idaho', 'Illinois', 'Indiana', 'Iowa', 'Kansas',
       'Kentucky', 'Louisiana', 'Maine', 'Maryland', 'Massachusetts',
       'Michigan', 'Minnesota', 'Mississippi', 'Missouri', 'Montana',
       'Nebraska', 'Nevada', 'New Hampshire', 'New Jersey', 'New Mexico',
       'New York', 'North Carolina', 'North Dakota', 'Ohio', 'Oklahoma',
       'Oregon', 'Pennsylvania', 'Rhode Island', 'South Carolina',
       'South Dakota', 'Tennessee', 'Texas', 'Utah', 'Vermont', 'Virginia',
       'Washington', 'West Virginia', 'Wisconsin', 'Wyoming'],
      dtype='object', name='state')
열 하나 선택하기
pets['rank']
state
Alabama                 17
Arizona                 18
Arkansas                 6
California              40
...
Virginia                37
Washington               5
West Virginia            7
Wisconsin               21
Wyoming                  9
Name: rank, dtype: int64
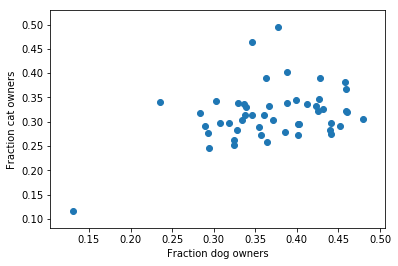
NumPy 및 Matplotlib 호환
plt.scatter(pets['frac_dog_owners'], pets['frac_cat_owners'])
연습해 봅시다!
MATLAB 사용자를 위한 Python

