다변량 데이터 시각화
R로 배우는 다변량 확률 분포

Surajit Ray
Professor, University of Glasgow
다변량 데이터용 기본 R 플롯
pairs(iris_raw[, 1:4])
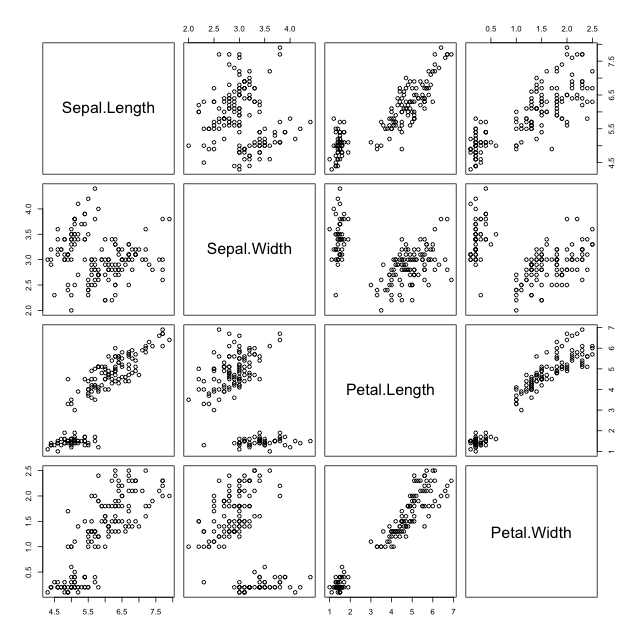
- 변수가 많을수록 플롯의 유용성이 감소함
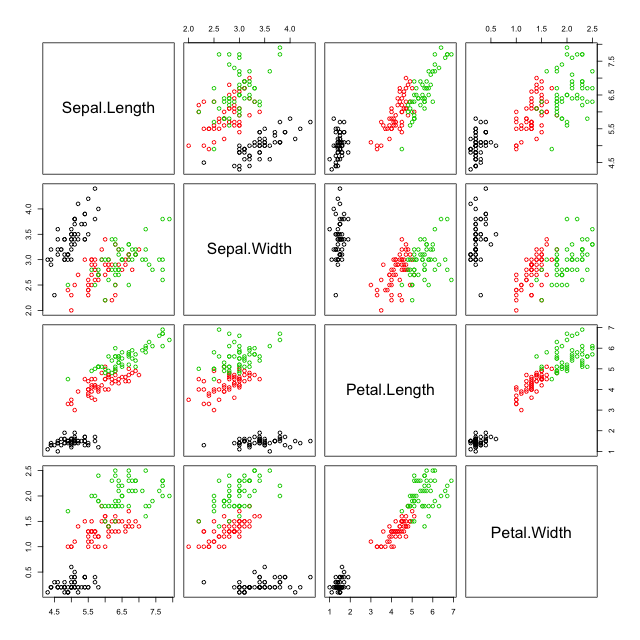
색상별 산점도 행렬
pairs(iris_raw[, 1:4], col = iris_raw$Species)
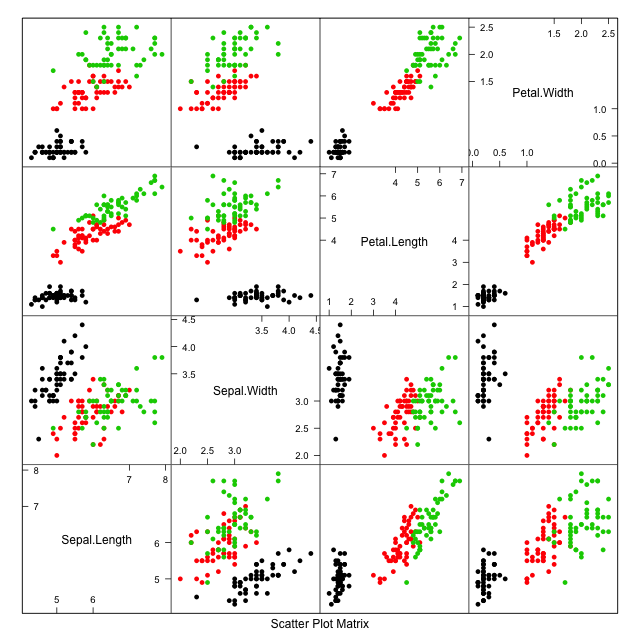
Lattice
library(lattice)
splom(~iris_raw[, 1:4], col = iris_raw$Species, pch = 16)
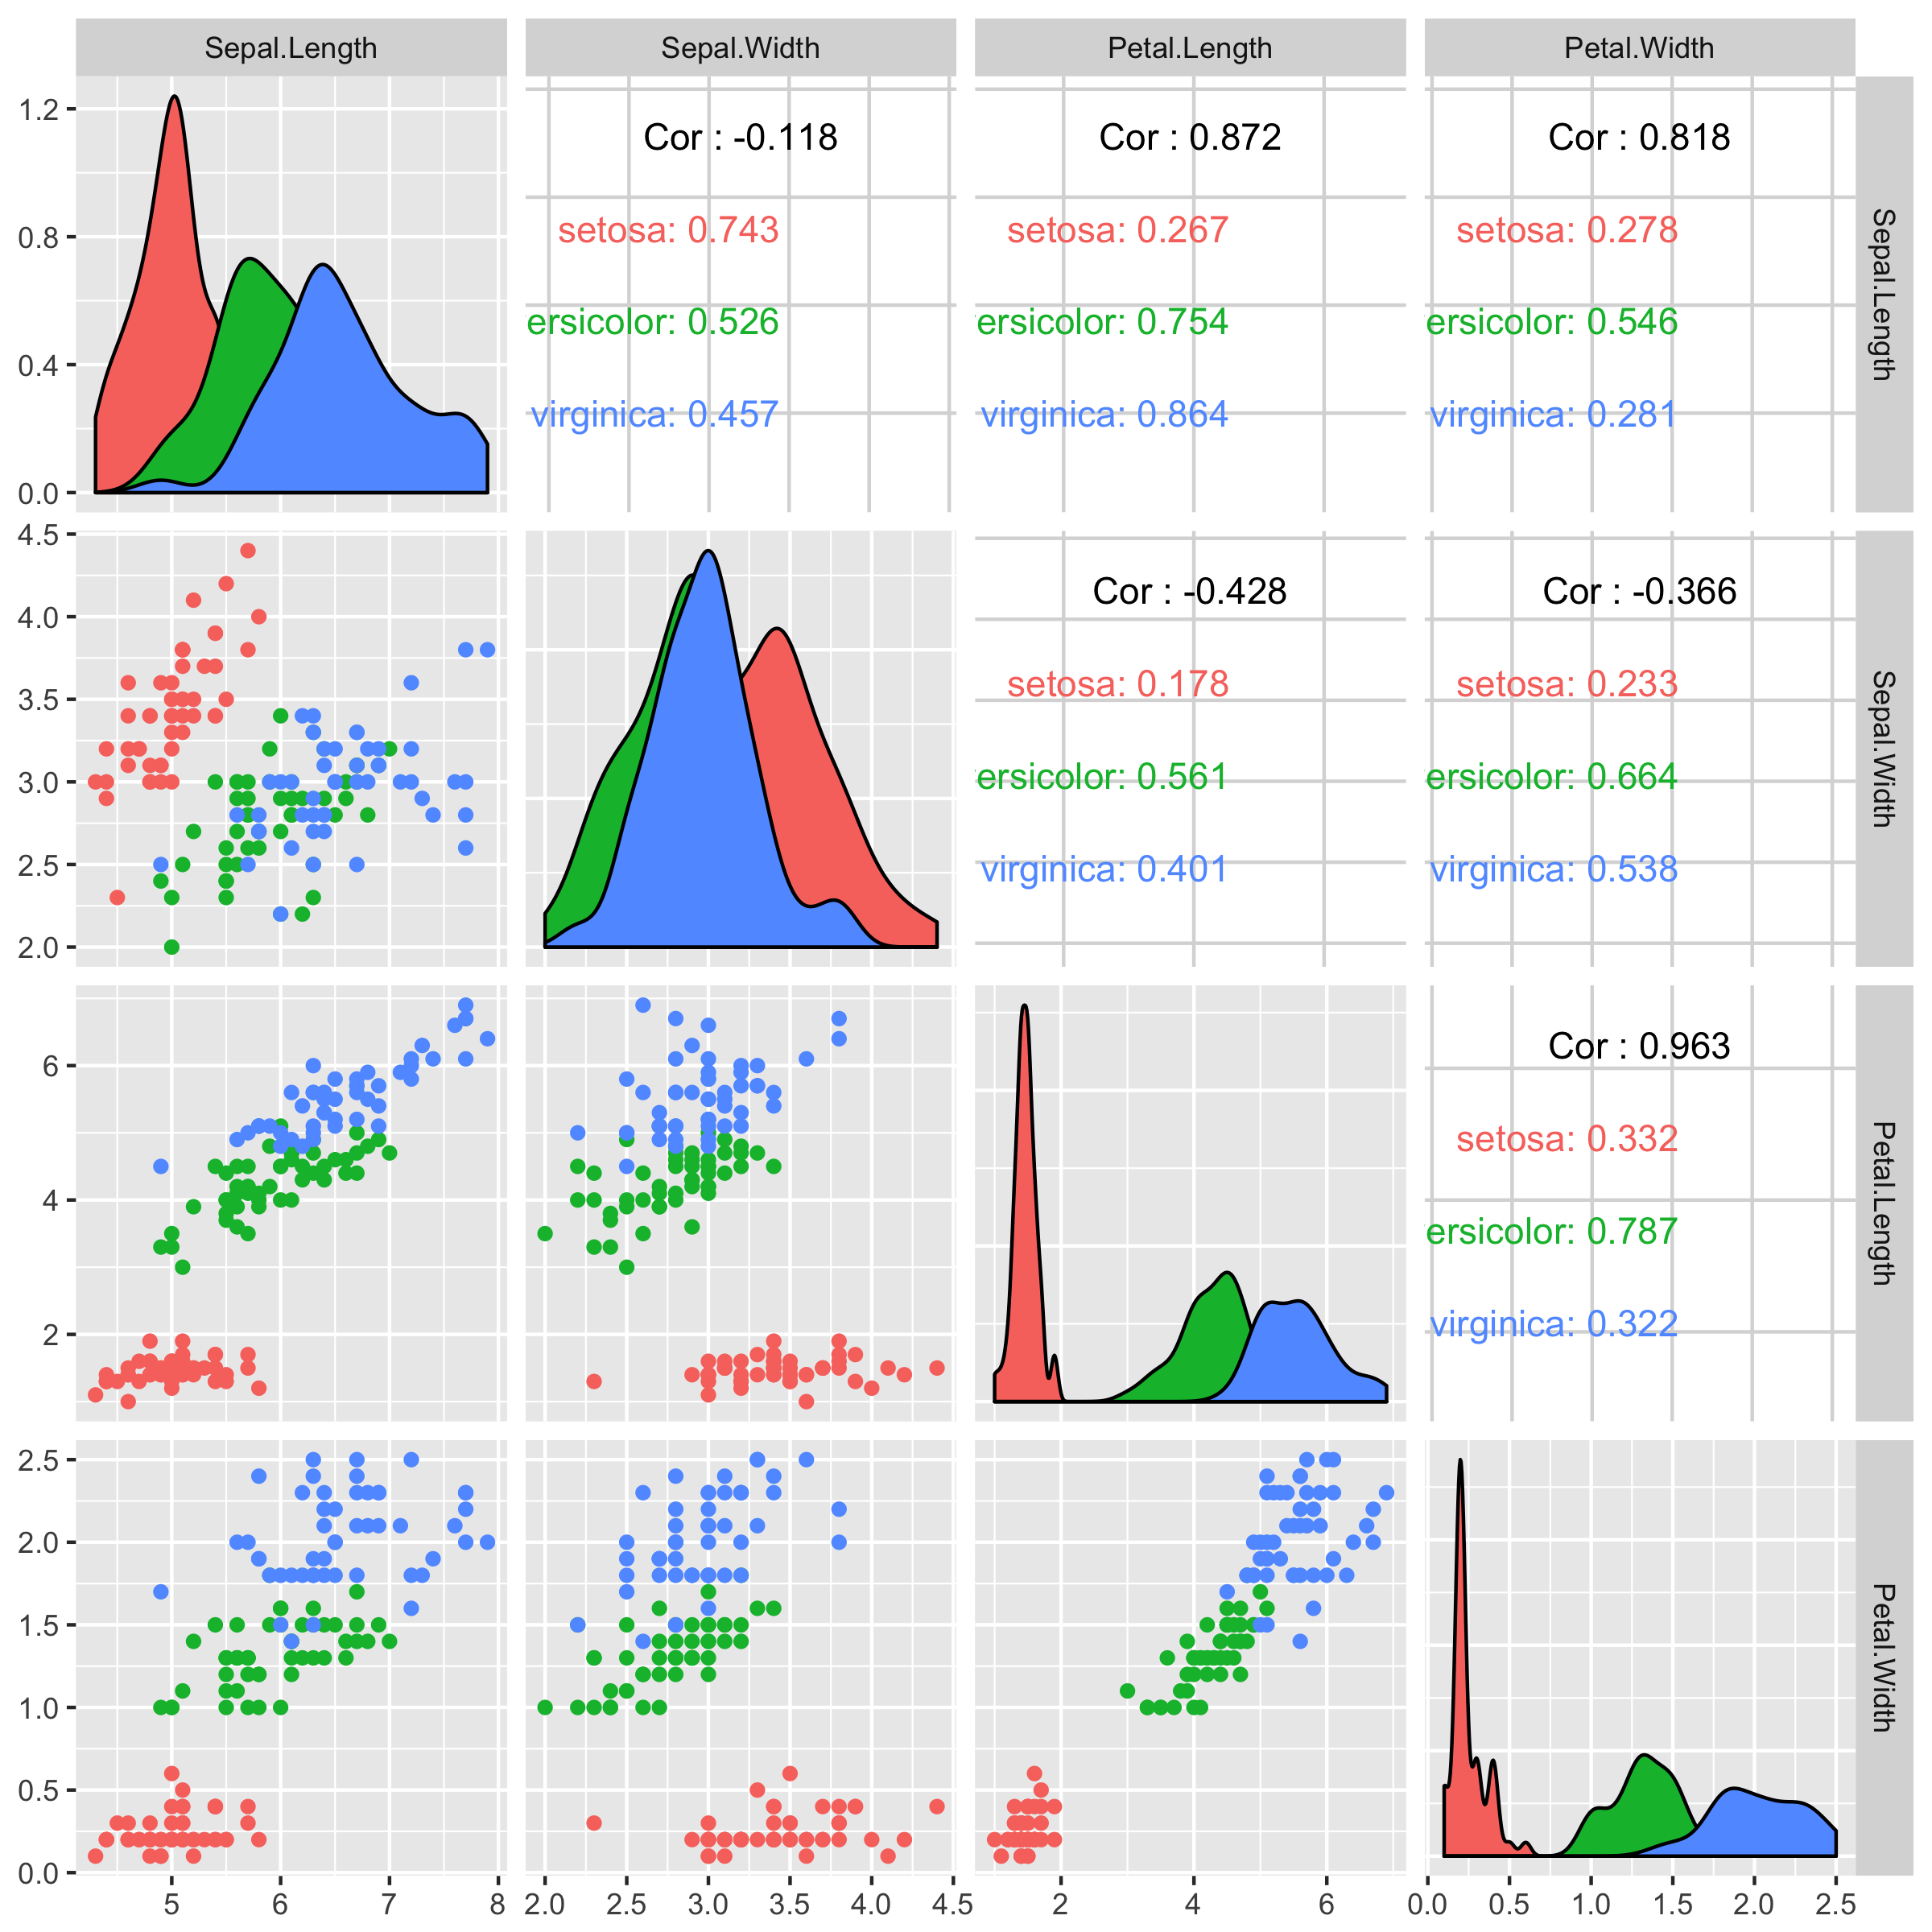
ggplot 활용
library(ggplot2)
library(GGally)
ggpairs(data = iris_raw, columns = 1:4, mapping = aes(color = Species))
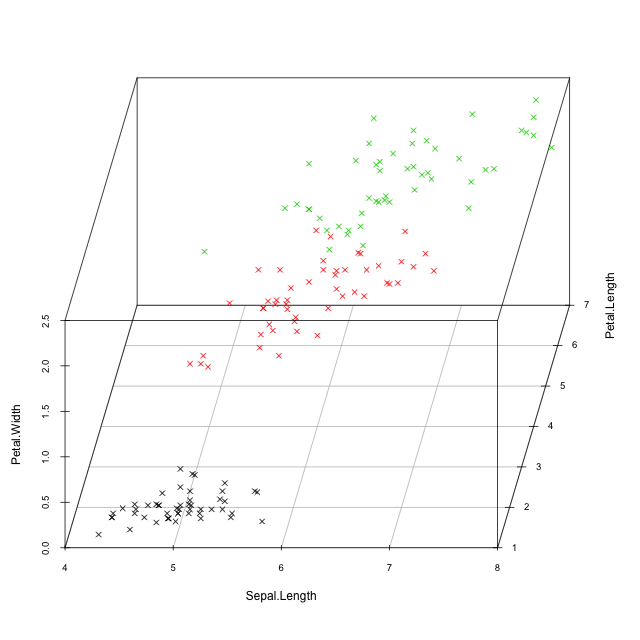
3D 플롯
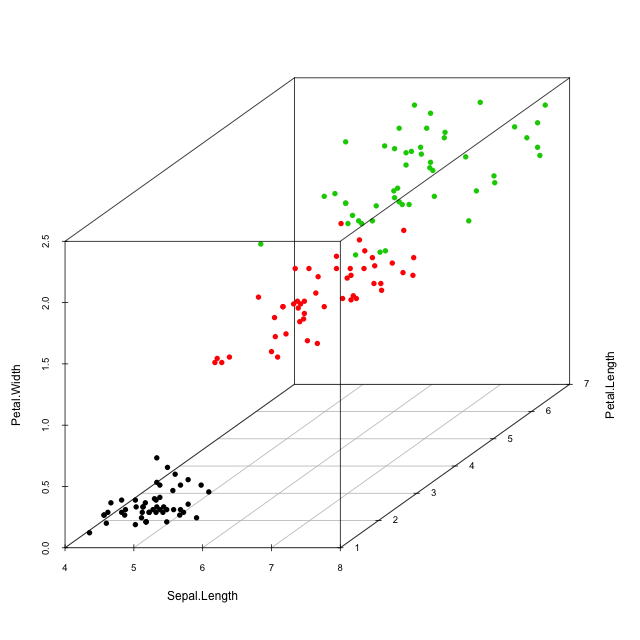
library(scatterplot3d)
scatterplot3d(iris_raw[, c(1, 3, 4)], color = as.numeric(iris_raw$Species))
3D 플롯
scatterplot3d(iris_raw[, c(1, 3, 4)], color = as.numeric(iris_raw$Species),pch = 4, angle = 80)