평균 벡터와 분산-공분산 행렬

R로 배우는 다변량 확률 분포

Surajit Ray

Professor, University of Glasgow

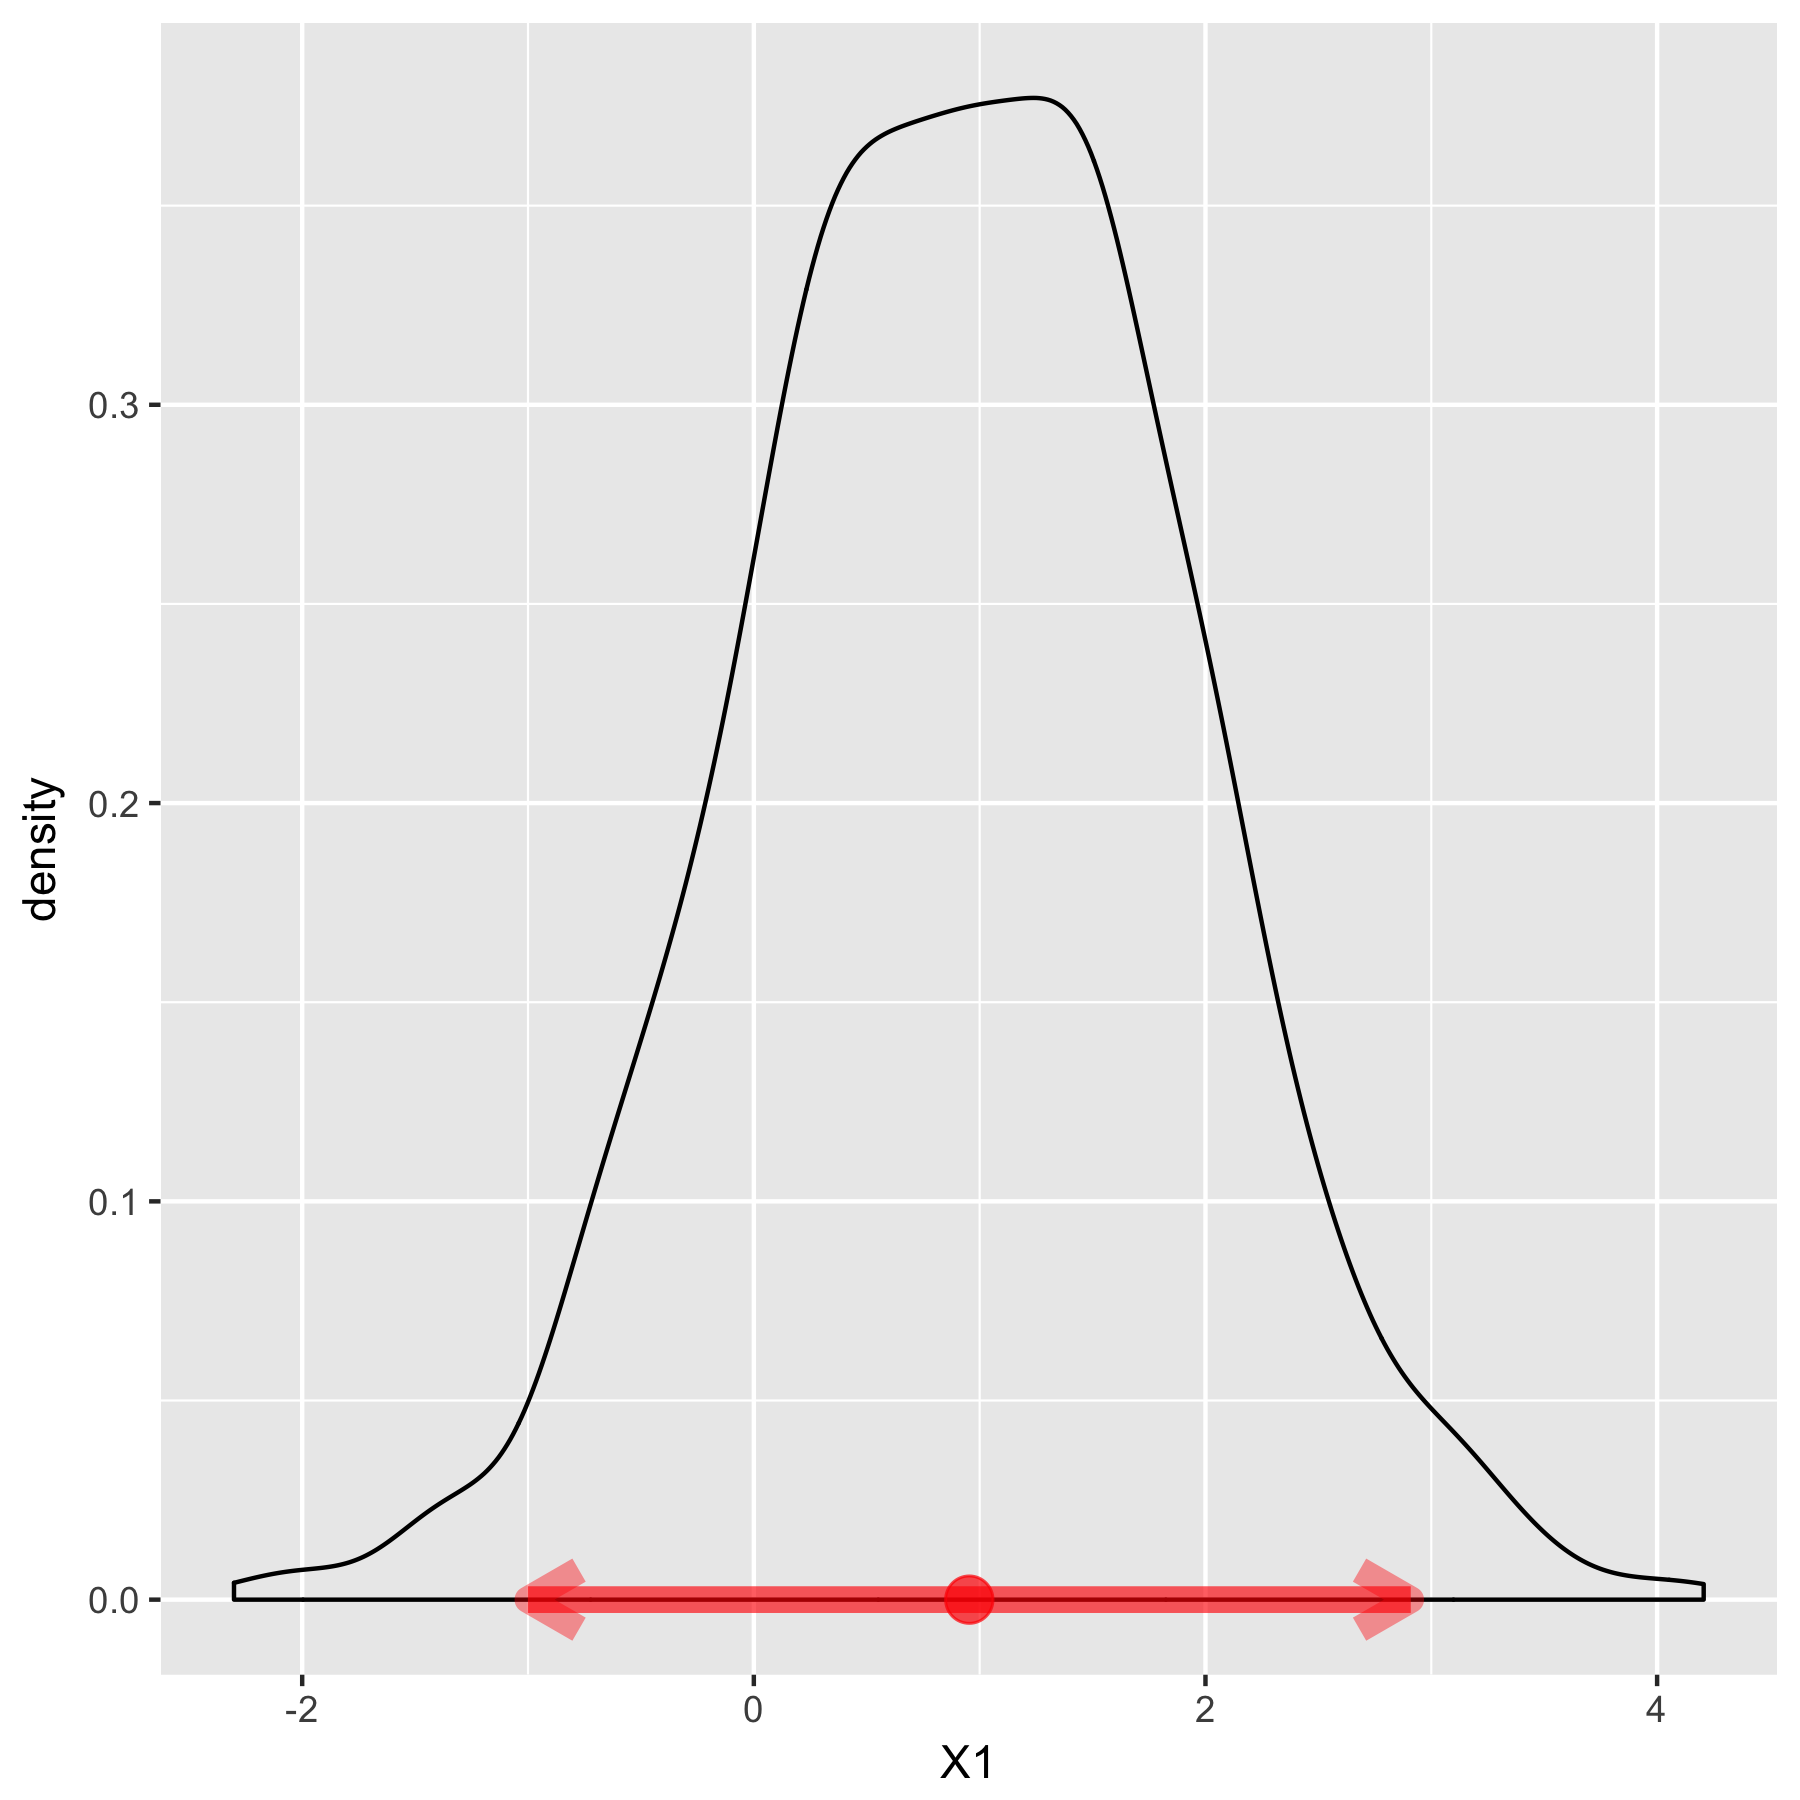
평균은 분포의 위치를 나타냄
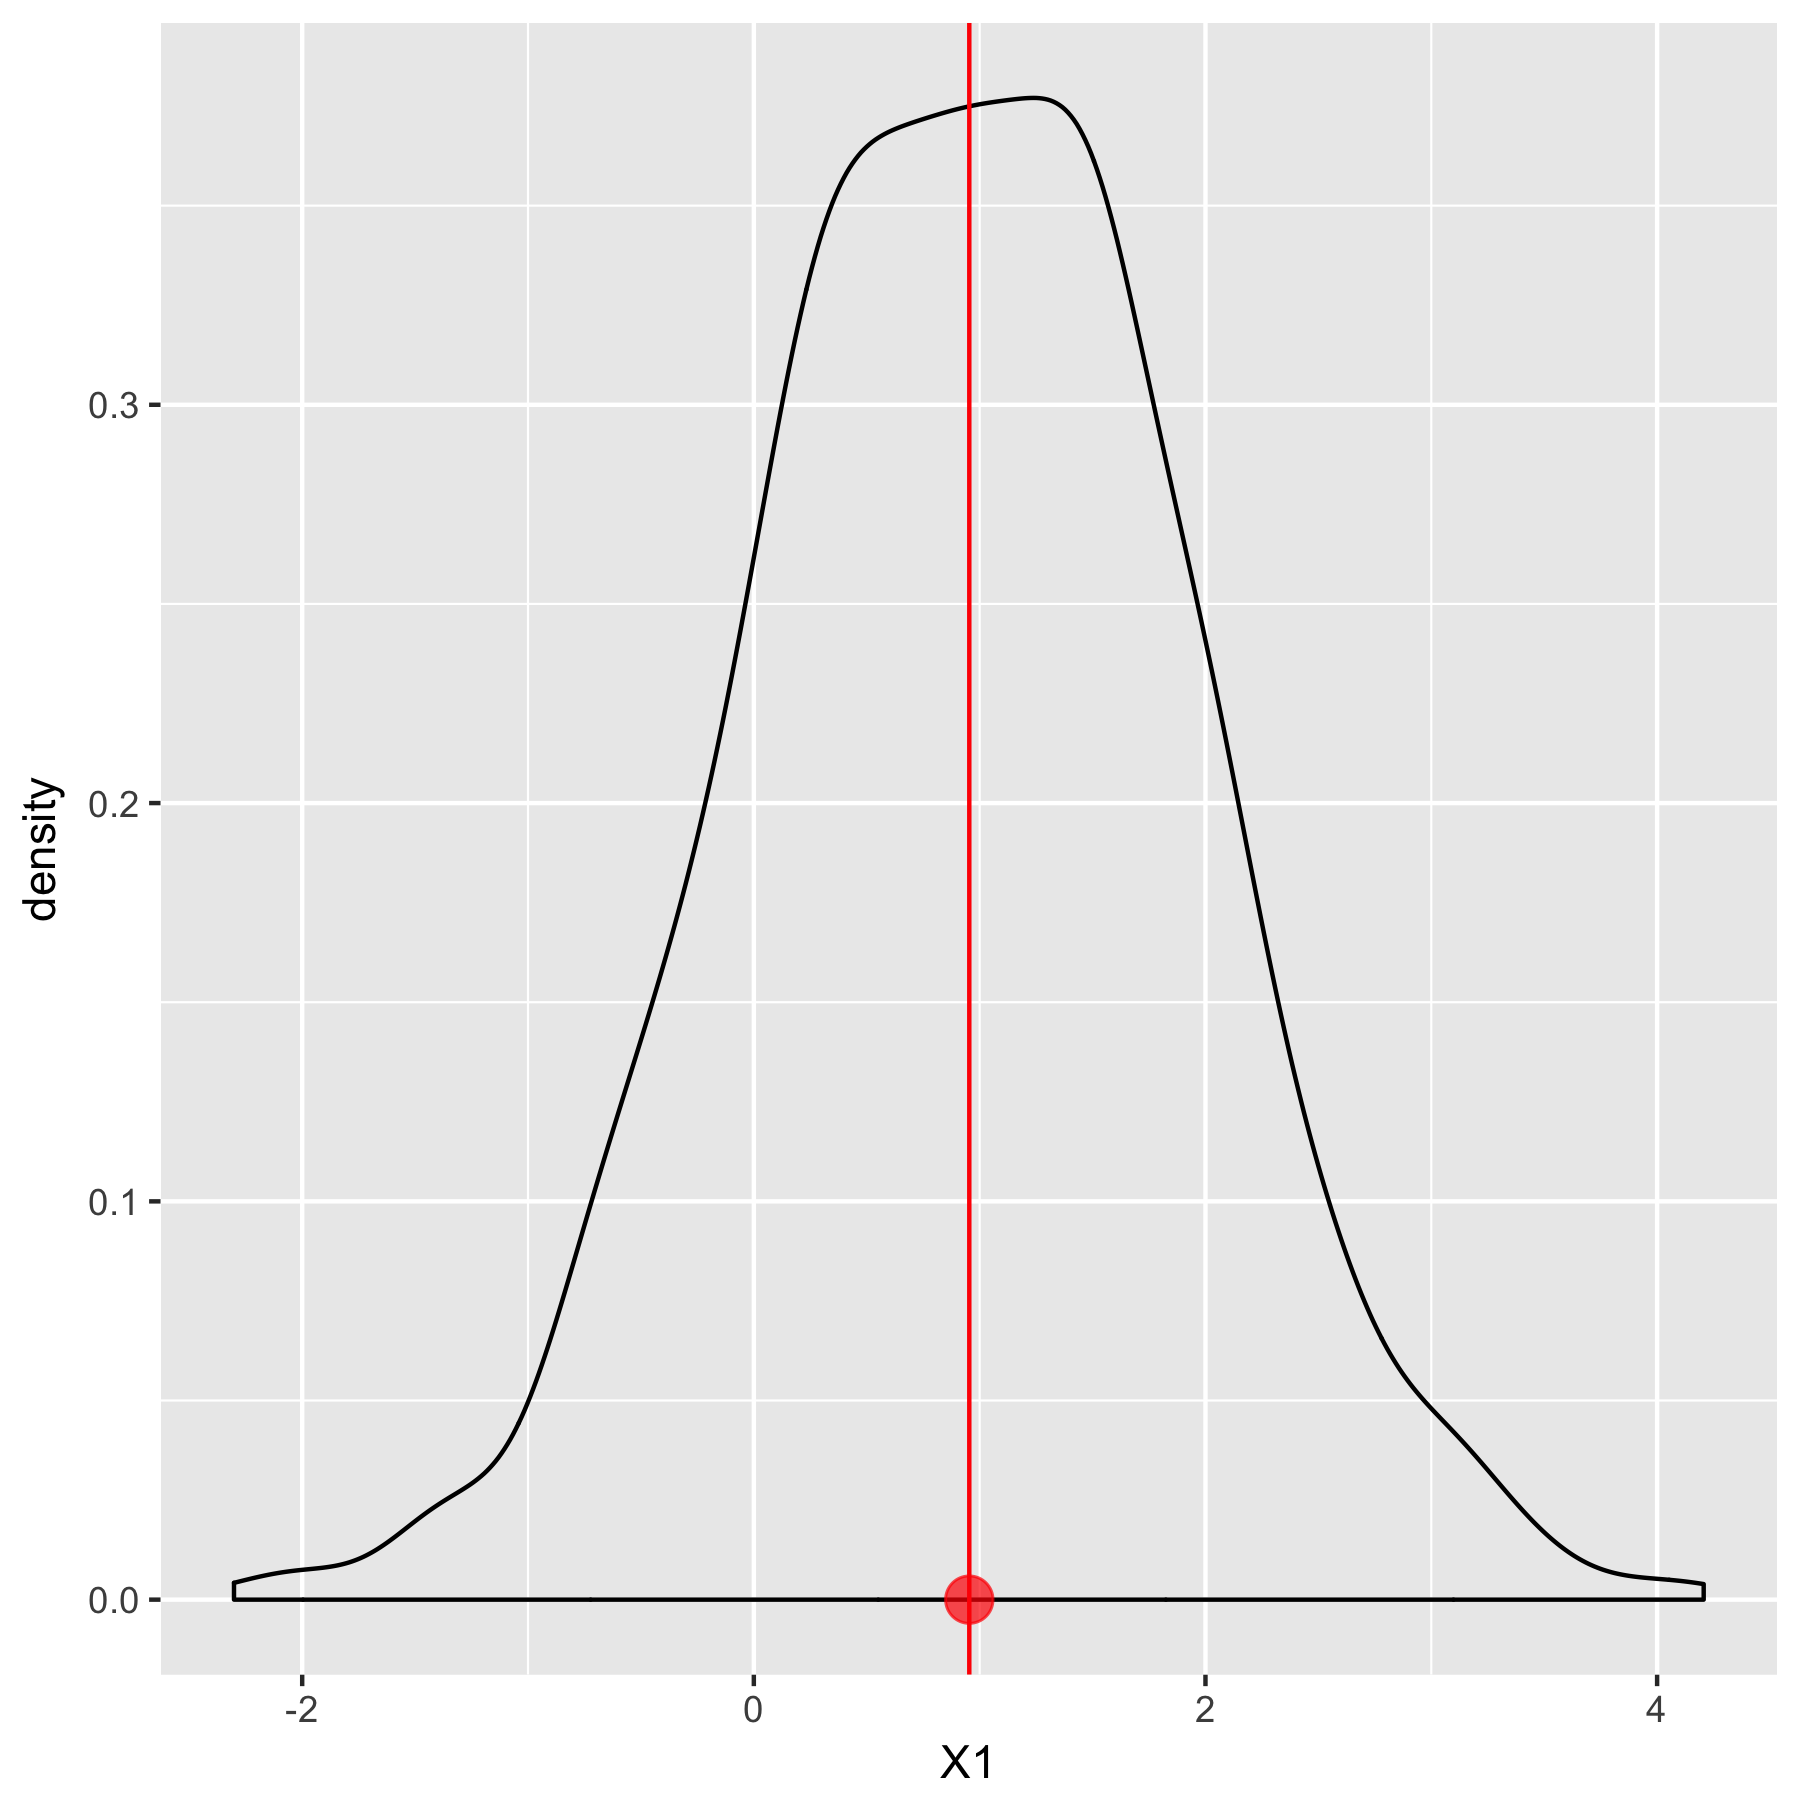
                                               평균 $0.95$
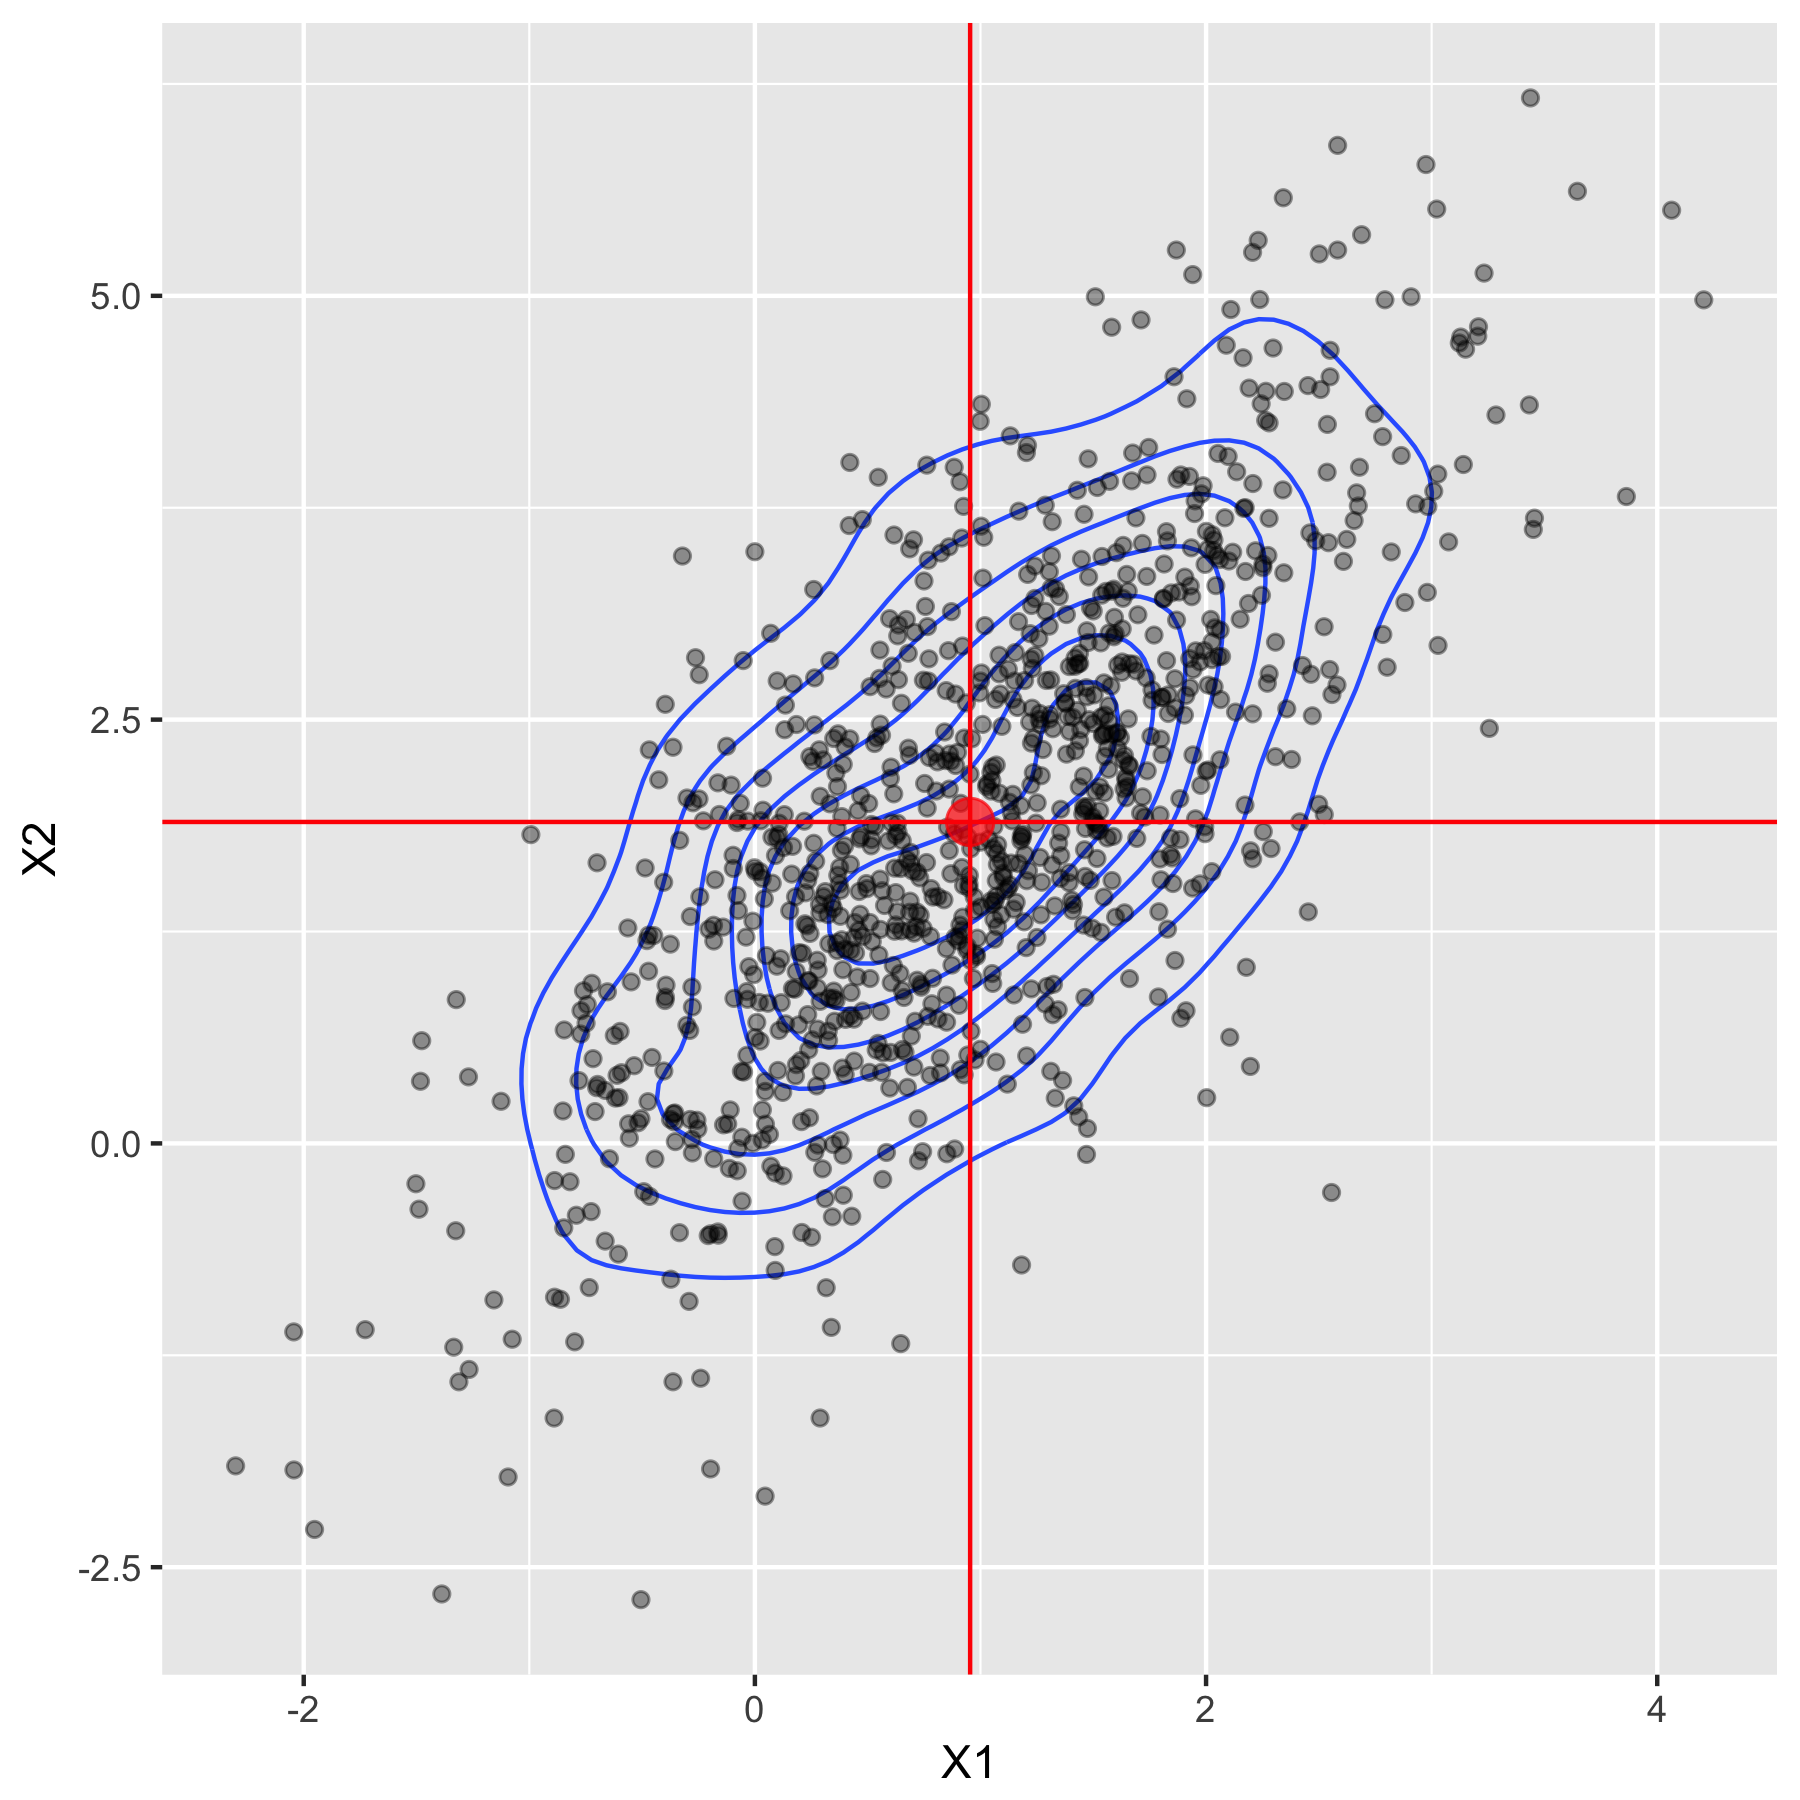
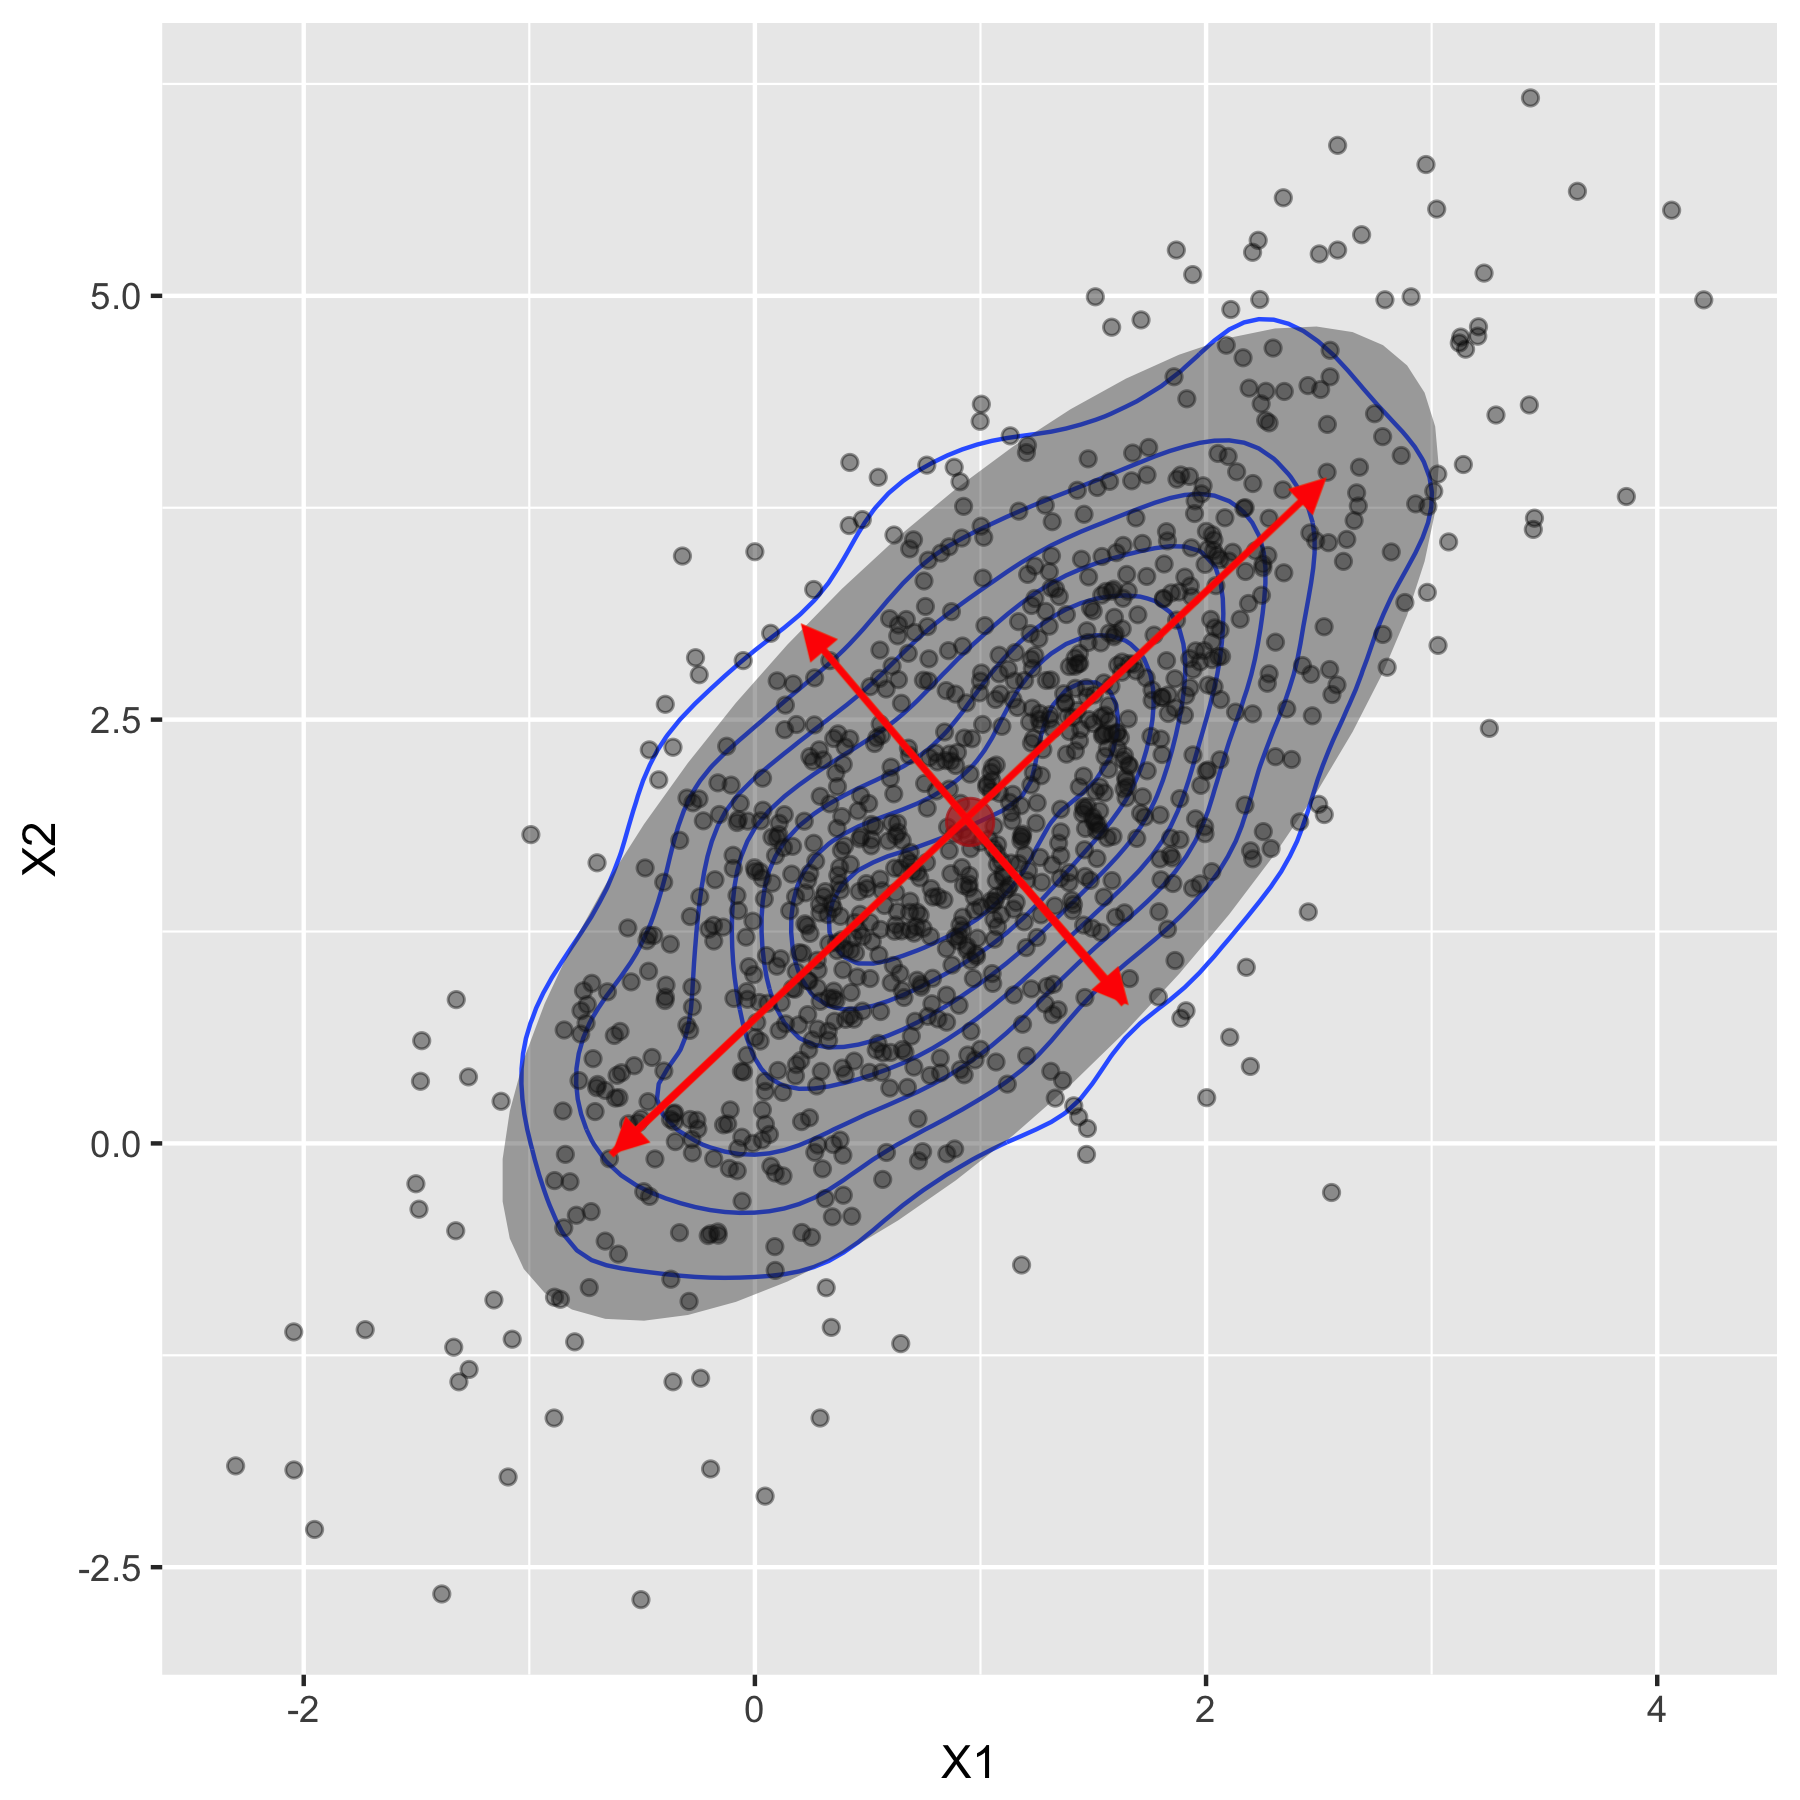
                                  평균 벡터 (0.95 1.89)

R로 배우는 다변량 확률 분포

분산-공분산 행렬은 퍼짐을 나타냄

                                            분산 $1.02$

분산-공분산 행렬 ${\begin{pmatrix} 1.02 & 0.97 \\ 0.97 & 2 \end{pmatrix}}$

R로 배우는 다변량 확률 분포

평균 계산

colMeans(iris_raw[, 1:4])
Sepal.Length  Sepal.Width Petal.Length  Petal.Width 
        5.84         3.05         3.76         1.20

부분 집단별 평균 계산 함수

  • by()
  • aggregate()
R로 배우는 다변량 확률 분포

by를 사용한 그룹 평균 계산

by(data = iris[,1:4], INDICES = iris$Species, FUN = colMeans)
iris_raw$Species: setosa
Sepal.Length  Sepal.Width Petal.Length  Petal.Width 
       5.006        3.418        1.464        0.244 
 ----------------------------------------------------
iris_raw$Species: versicolor
Sepal.Length  Sepal.Width Petal.Length  Petal.Width 
       5.936        2.770        4.260        1.326 
 ----------------------------------------------------
iris_raw$Species: virginica
Sepal.Length  Sepal.Width Petal.Length  Petal.Width 
       6.588        2.974        5.552        2.026
R로 배우는 다변량 확률 분포

aggregate를 사용한 그룹 평균 계산

aggregate(. ~ Species, iris_raw, mean)
     Species Sepal.Length Sepal.Width Petal.Length Petal.Width
1     setosa         5.01        3.42         1.46       0.244
2 versicolor         5.94        2.77         4.26       1.326
3  virginica         6.59        2.97         5.55       2.026
R로 배우는 다변량 확률 분포

분산-공분산 행렬과 상관 행렬 계산

var(iris_raw[, 1:4])
             Sepal.Length Sepal.Width Petal.Length Petal.Width
Sepal.Length       0.6857     -0.0393        1.274       0.517
Sepal.Width       -0.0393      0.1880       -0.322      -0.118
Petal.Length       1.2737     -0.3217        3.113       1.296
Petal.Width        0.5169     -0.1180        1.296       0.582

상관 행렬

cor(iris_raw[, 1:4])
             Sepal.Length Sepal.Width Petal.Length Petal.Width
Sepal.Length        1.000      -0.109        0.872       0.818
Sepal.Width        -0.109       1.000       -0.421      -0.357
Petal.Length        0.872      -0.421        1.000       0.963
Petal.Width         0.818      -0.357        0.963       1.000
R로 배우는 다변량 확률 분포

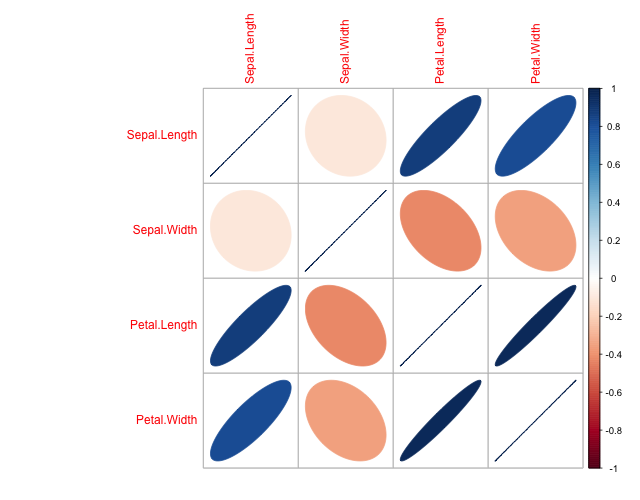
상관 행렬 시각화

corrplot 함수로 상관 행렬 시각화

corrplot(cor(iris_raw[, 1:4]), method = "ellipse")
R로 배우는 다변량 확률 분포

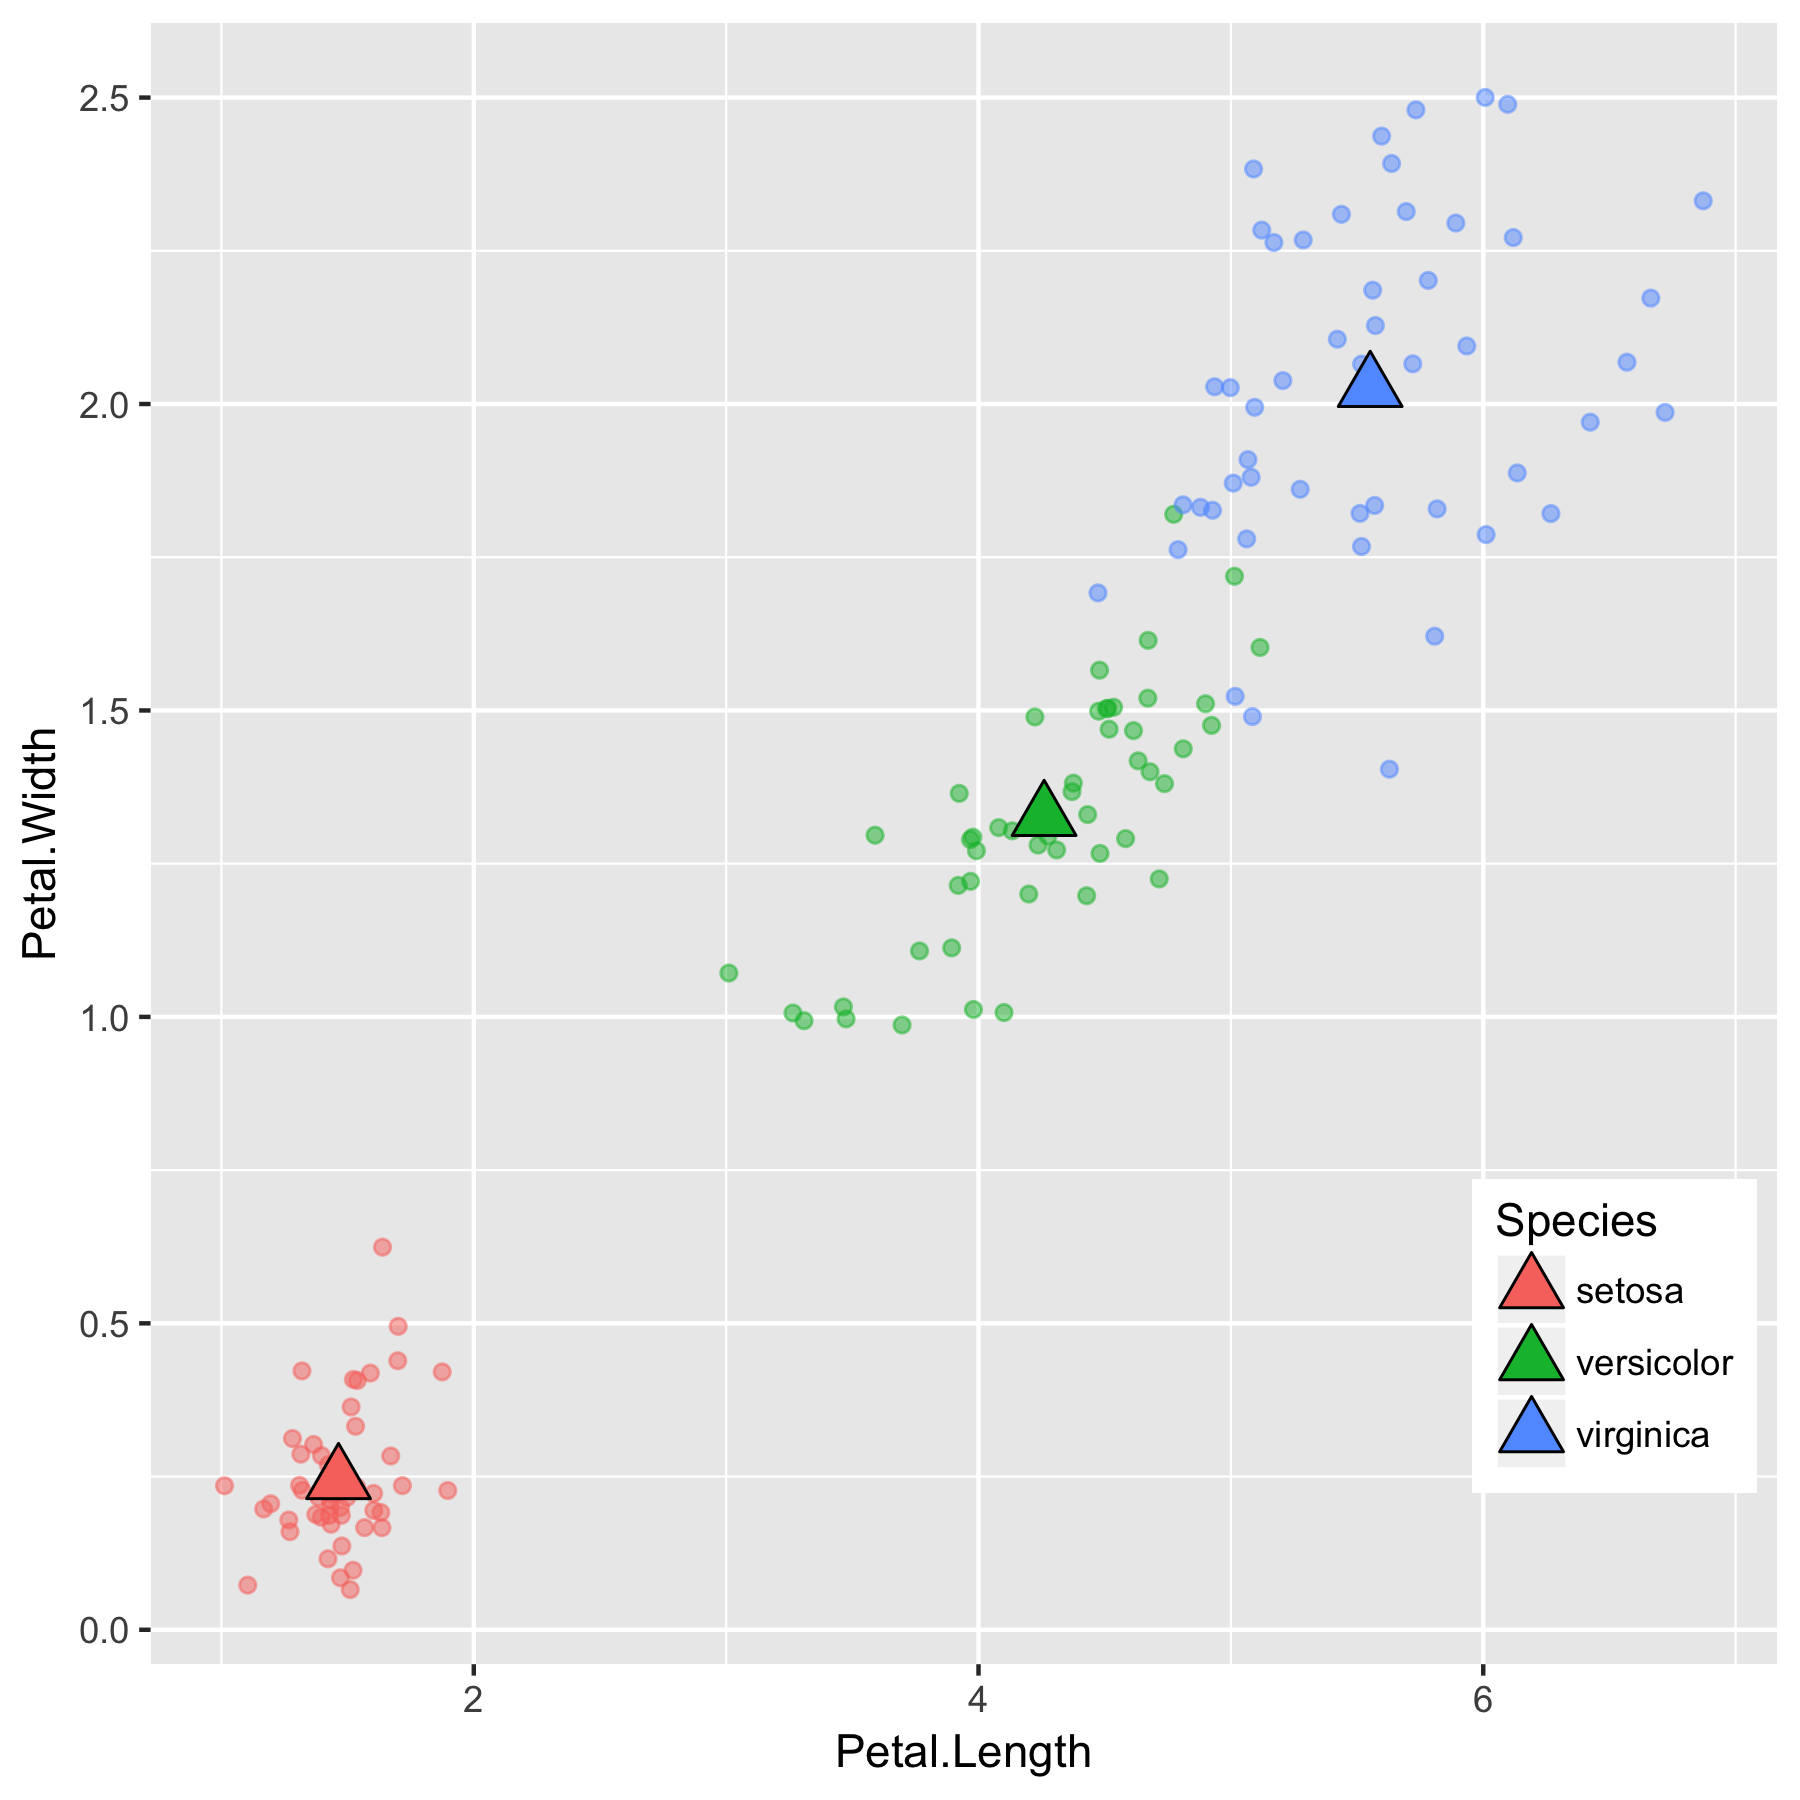
평균 해석

평균

Species Petal.Length Petal.Width
setosa 1.46 0.244
versicolor 4.26 1.326
virginica 5.55 2.026

평균

R로 배우는 다변량 확률 분포

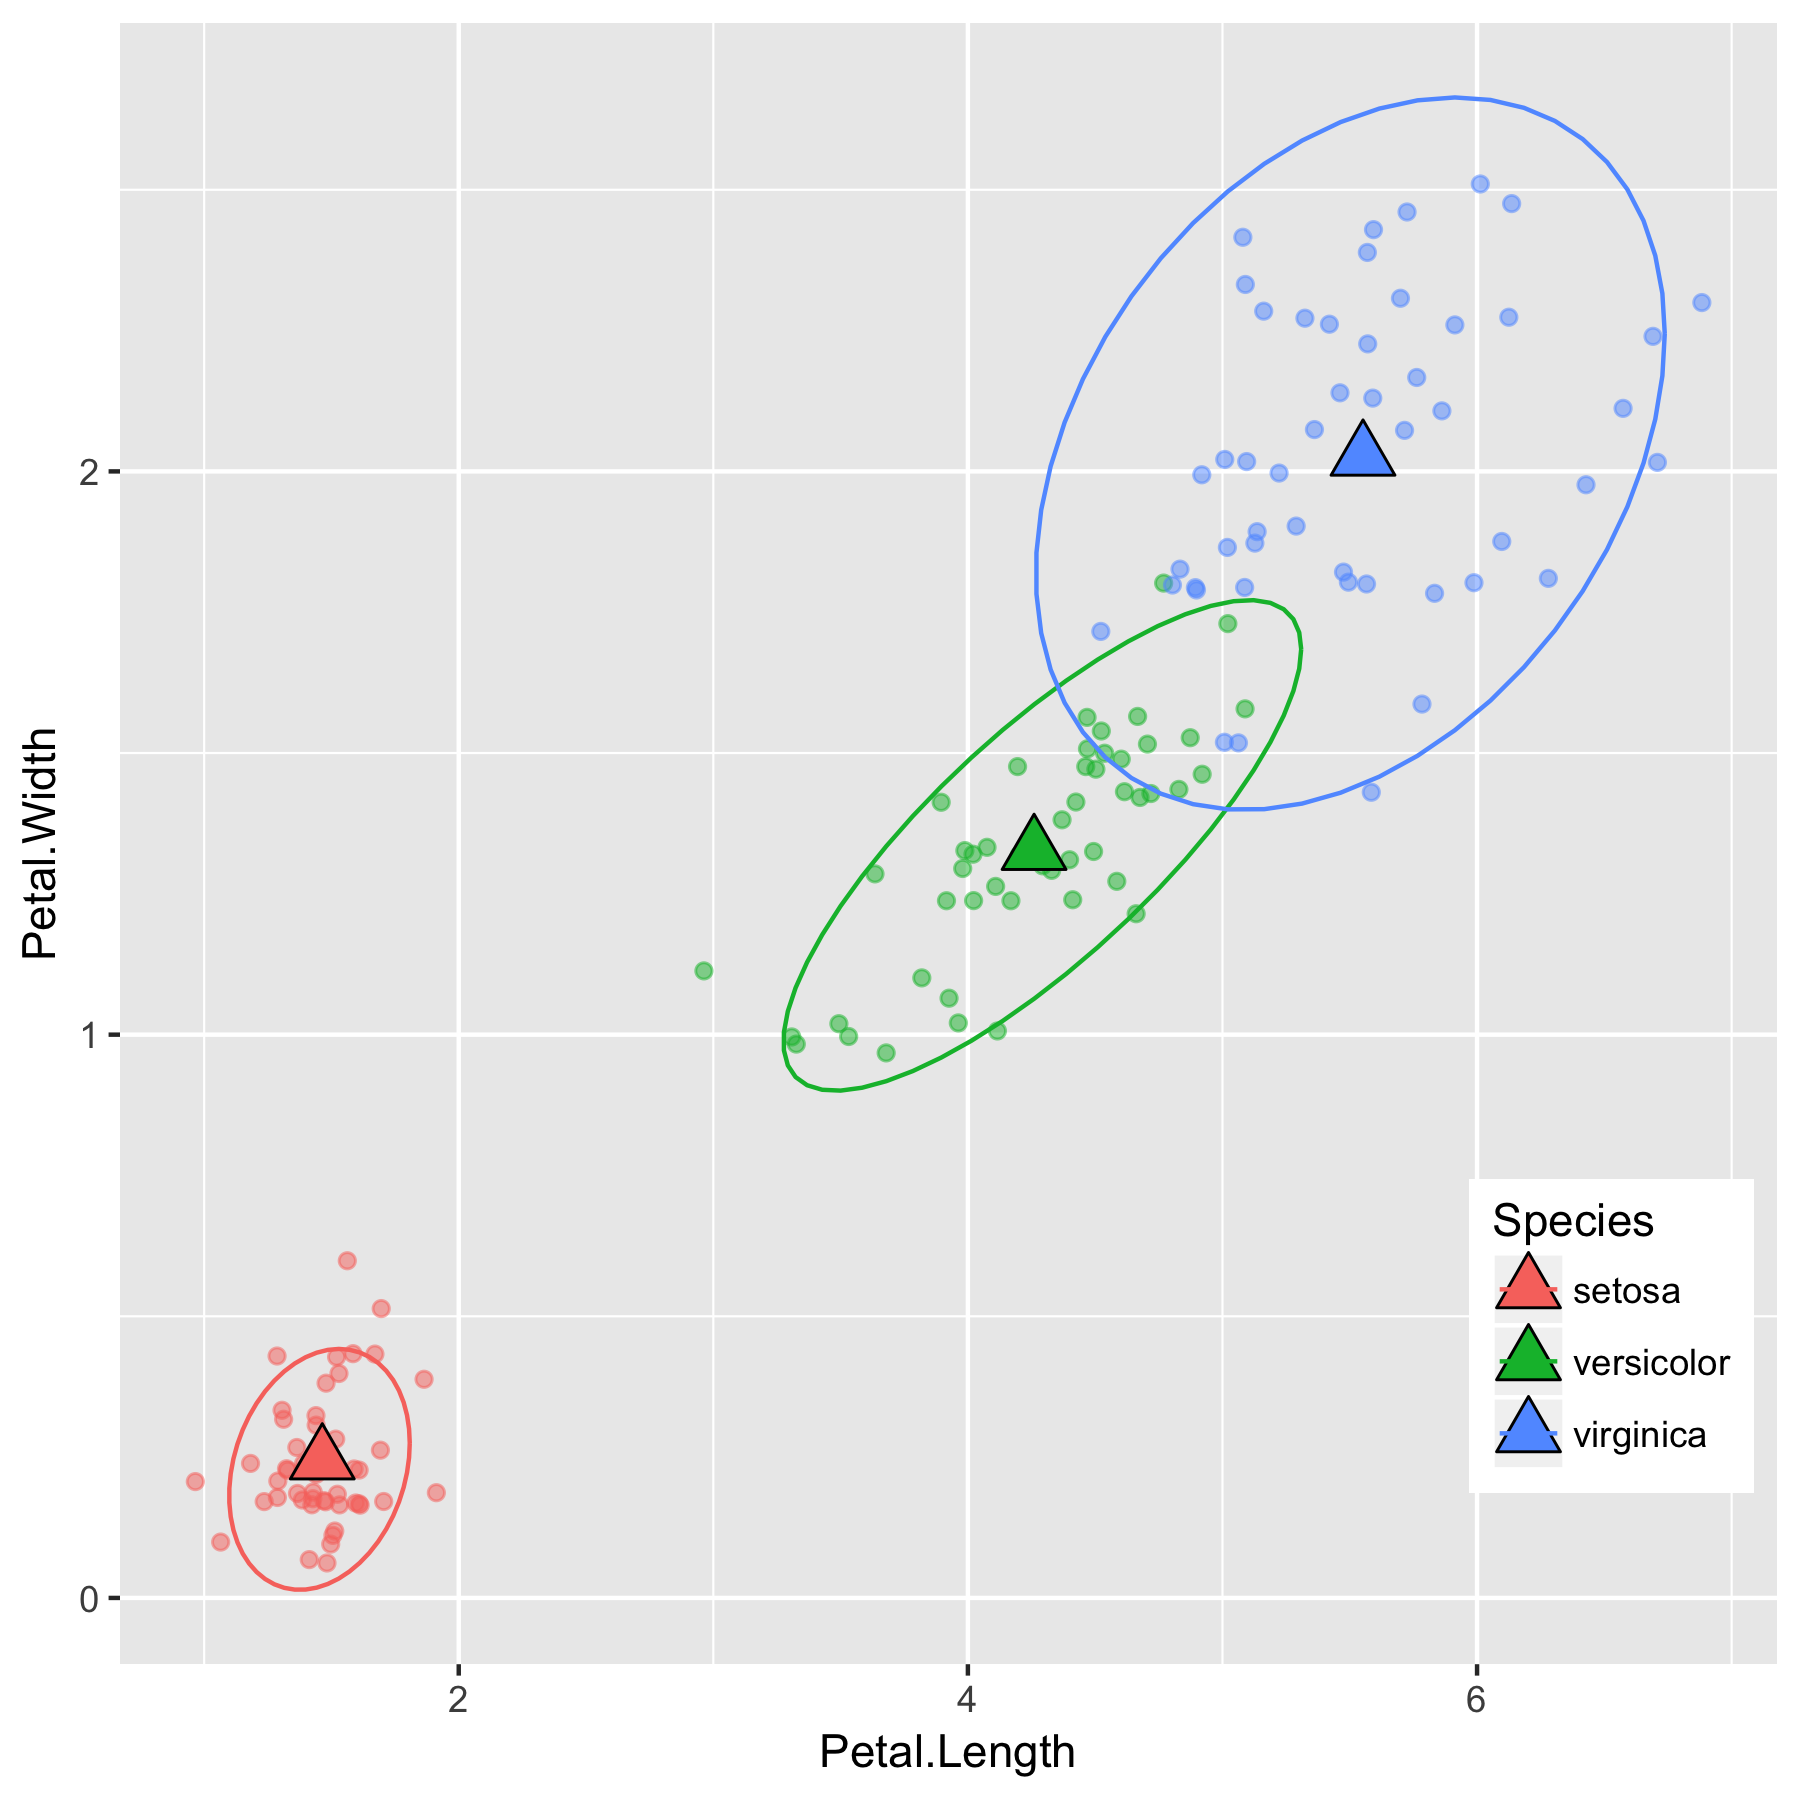
분산 해석

setosa Petal.Length Petal.Width
Petal.Length 0.030 0.006
Petal.Width 0.006 0.011
versicolor Petal.Length Petal.Width
Petal.Length 0.221 0.073
Petal.Width 0.073 0.039
virginica Petal.Length Petal.Width
Petal.Length 0.305 0.049
Petal.Width 0.049 0.075

평균과 분산

R로 배우는 다변량 확률 분포

연습해 봅시다!

R로 배우는 다변량 확률 분포

Preparing Video For Download...