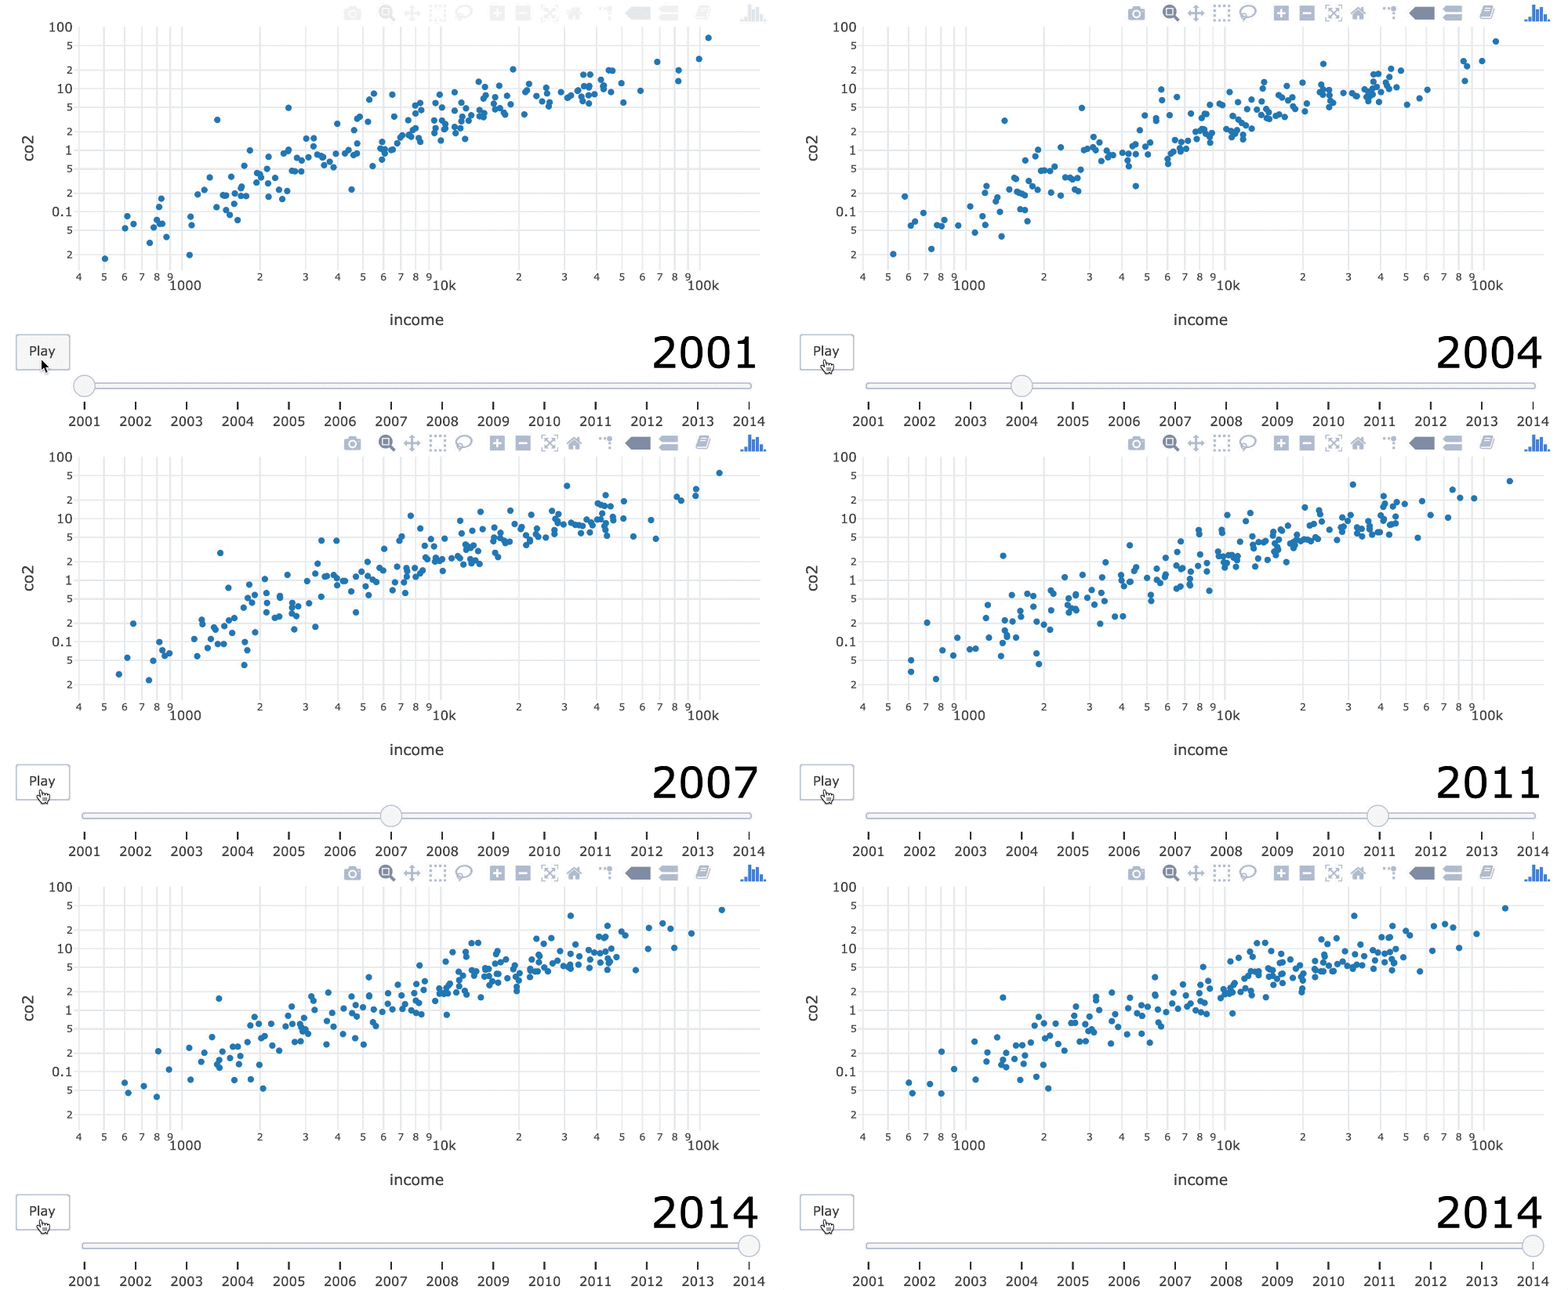
레이어 추가
R로 배우는 plotly 중급 인터랙티브 데이터 시각화

Adam Loy
Statistician, Carleton College
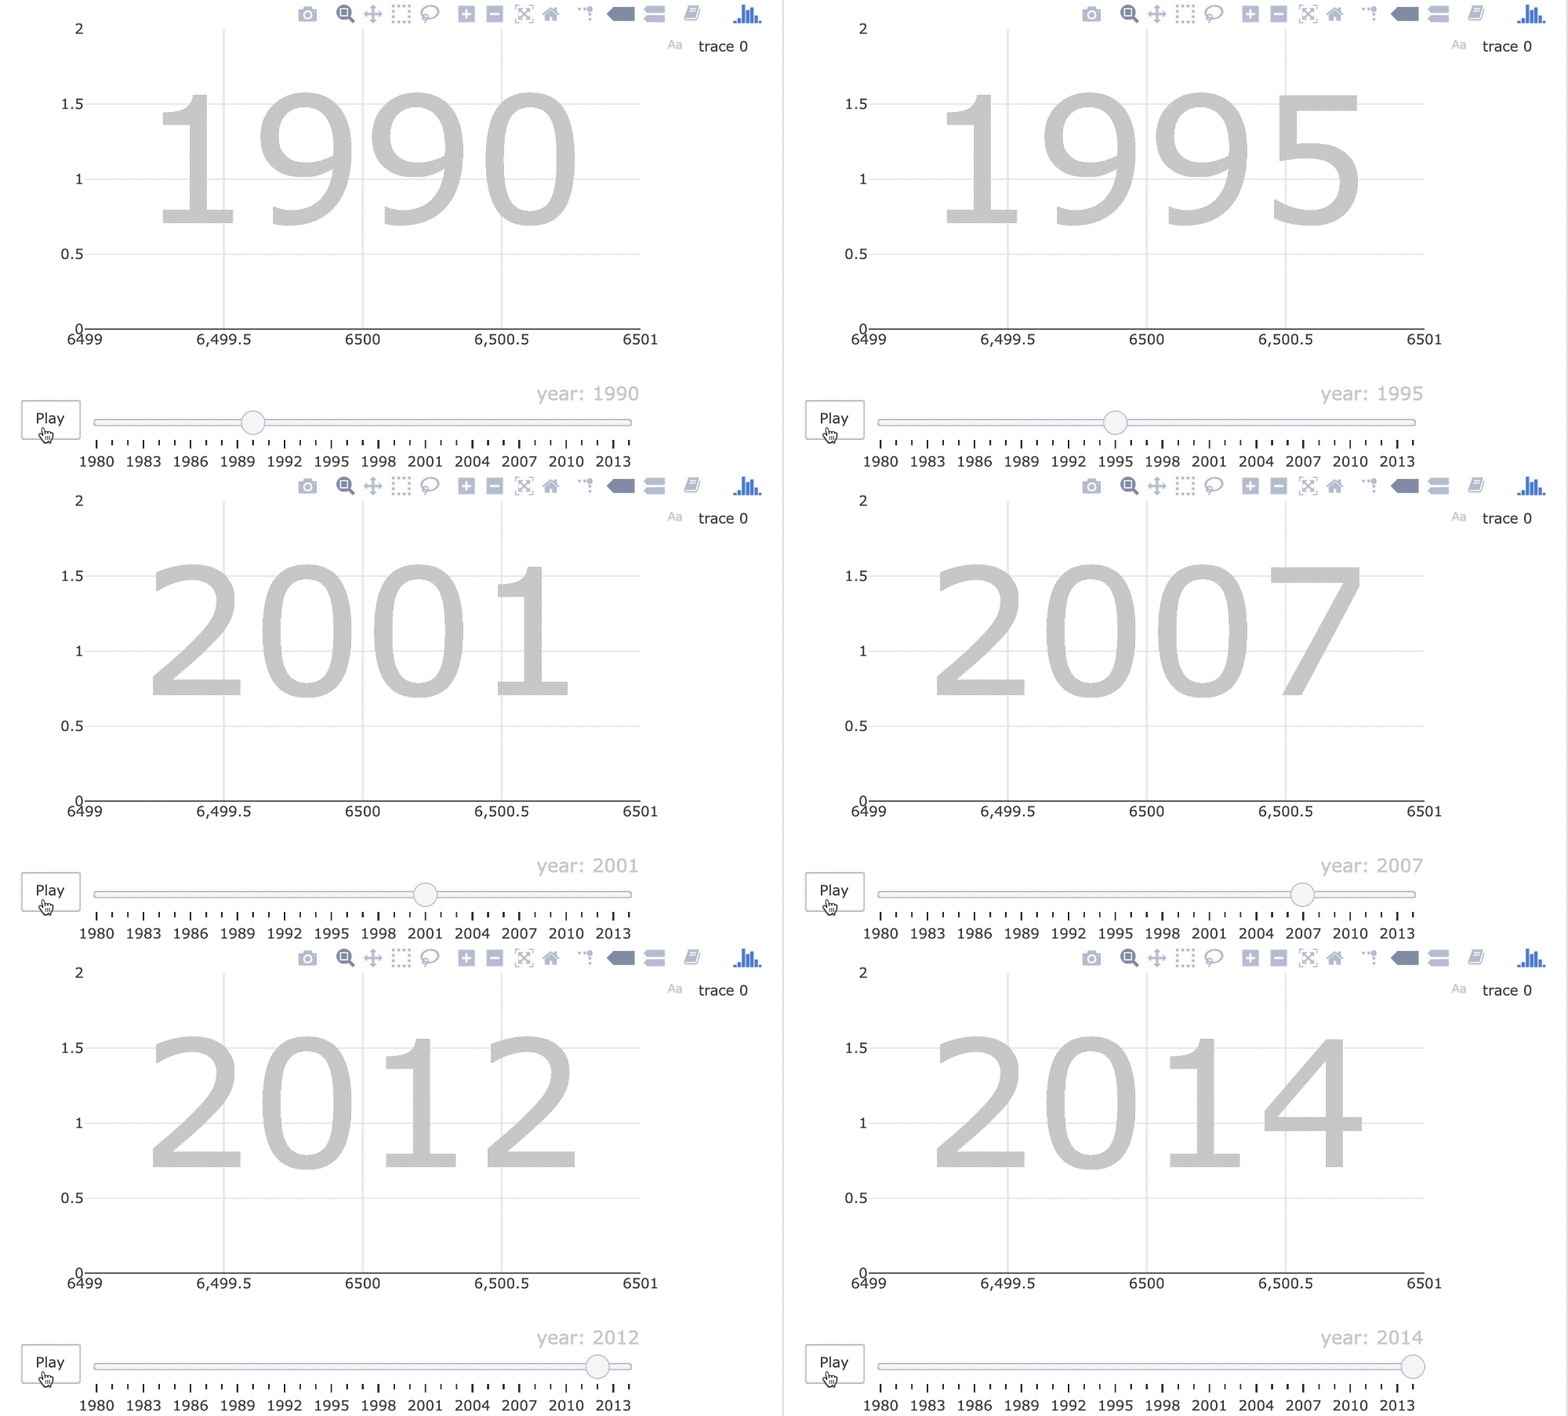
텍스트 레이어
world_indicators %>%
  plot_ly(x = ~income, y = ~co2) %>%
  add_text(
    x = 6500, y = 1, text = ~year, frame = ~year,
    textfont = list(size = 150, color = toRGB("gray80"))
  )
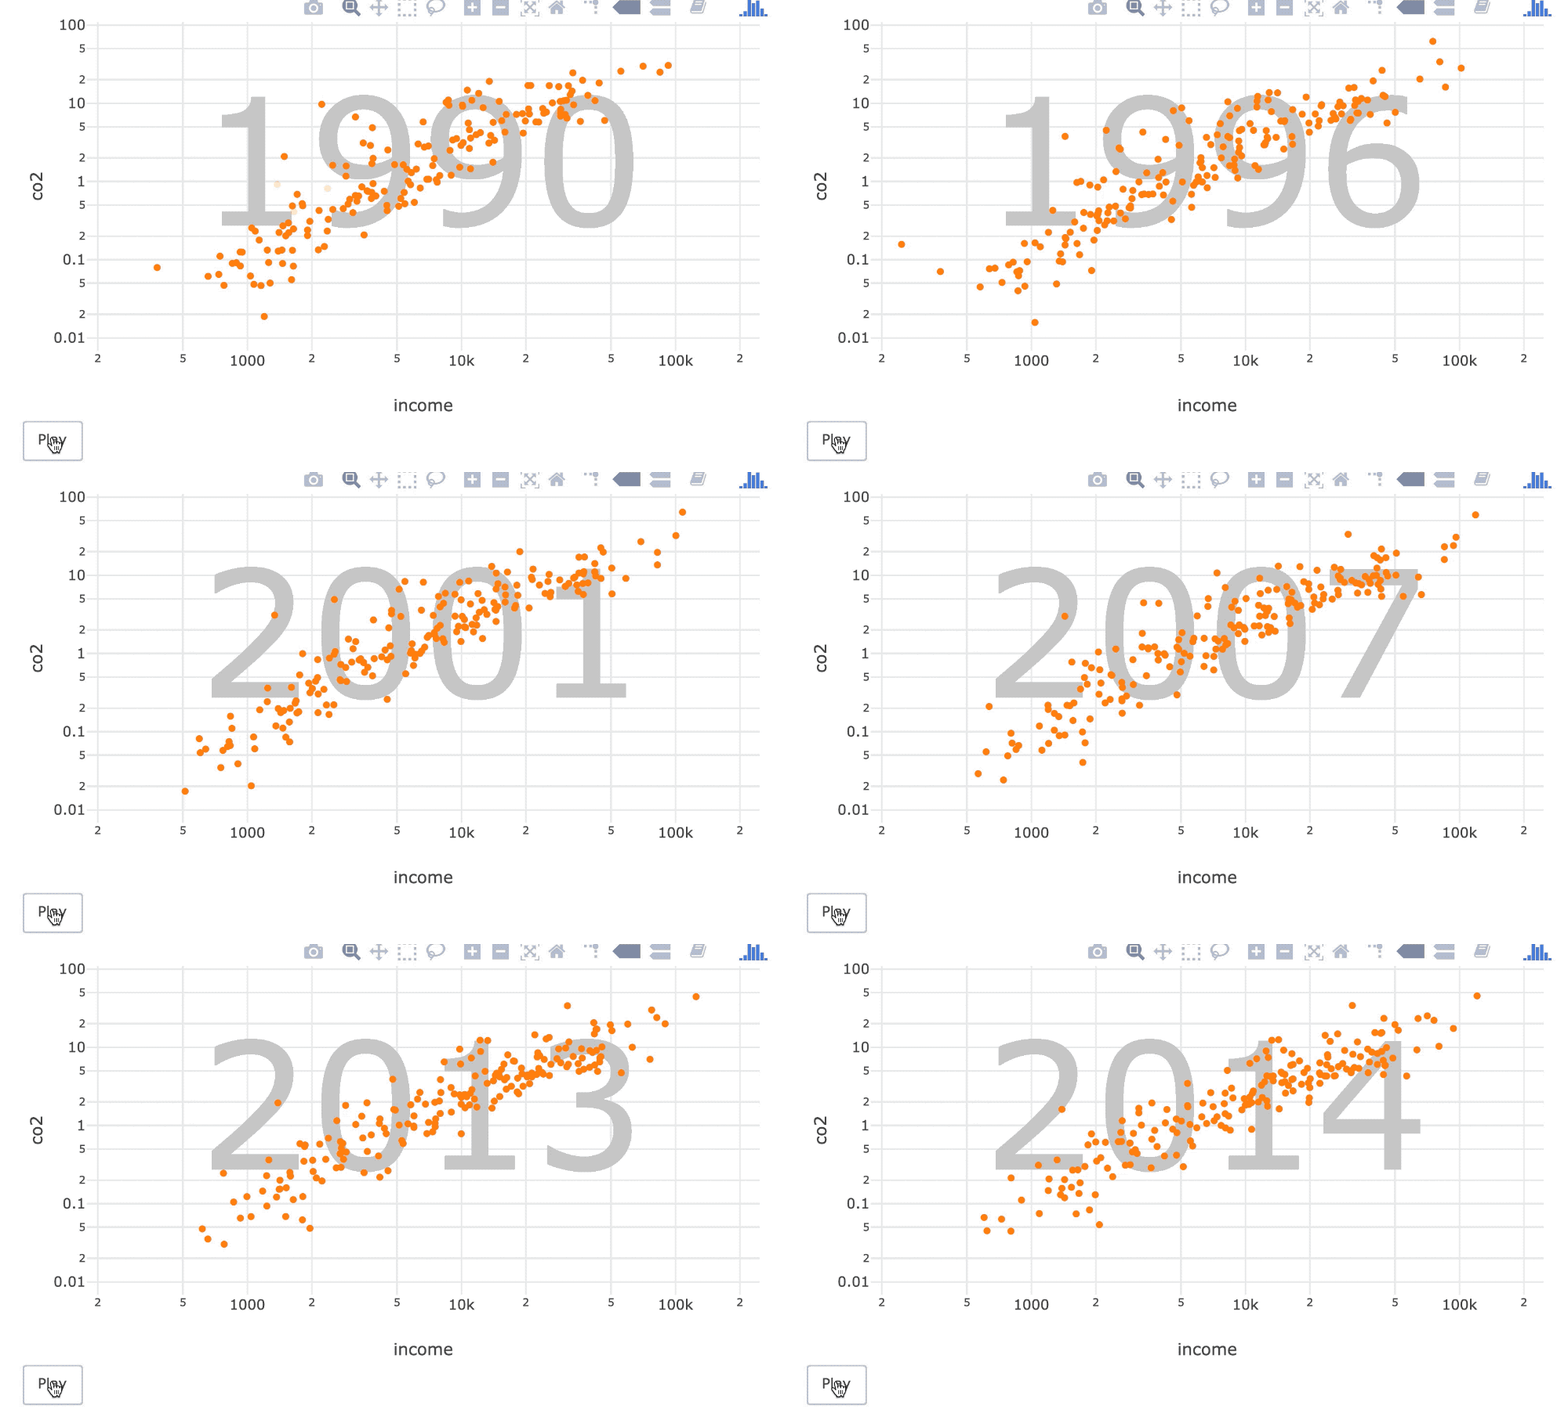
마무리 다듬기
world_indicators %>%
  plot_ly(x = ~income, y = ~co2) %>%
  add_text(
    x = 6500, y = 1, text = ~year, frame = ~year,
    textfont = list(size = 150, color = toRGB("gray80"))
  ) %>%
  add_markers(frame = ~year, ids = ~country) %>%
  layout(
    xaxis = list(type = "log"), yaxis = list(type = "log"),
    showlegend = FALSE
  ) %>%
  animation_slider(hide = TRUE)