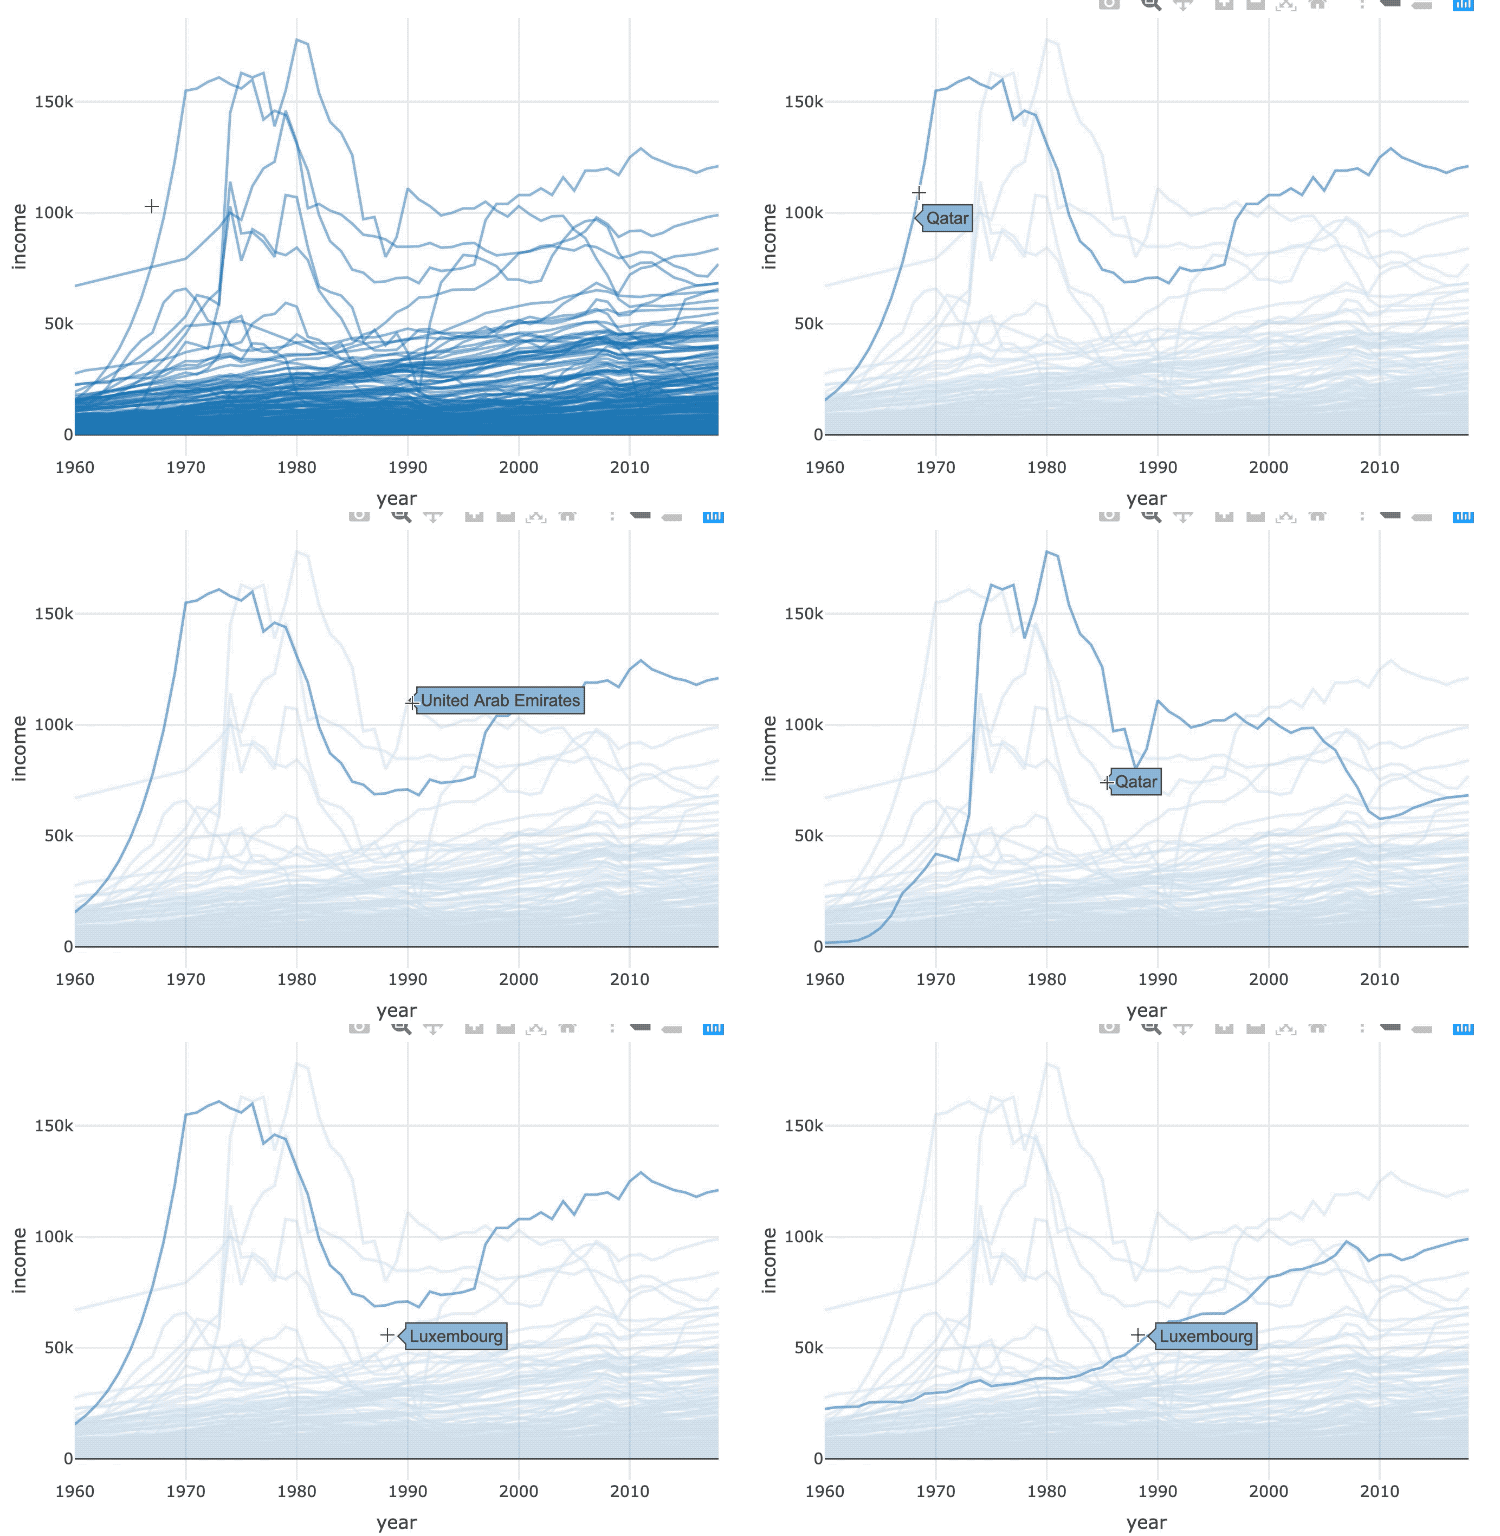
선택 전략

R로 배우는 plotly 중급 인터랙티브 데이터 시각화

Adam Loy

Statistician, Carleton College

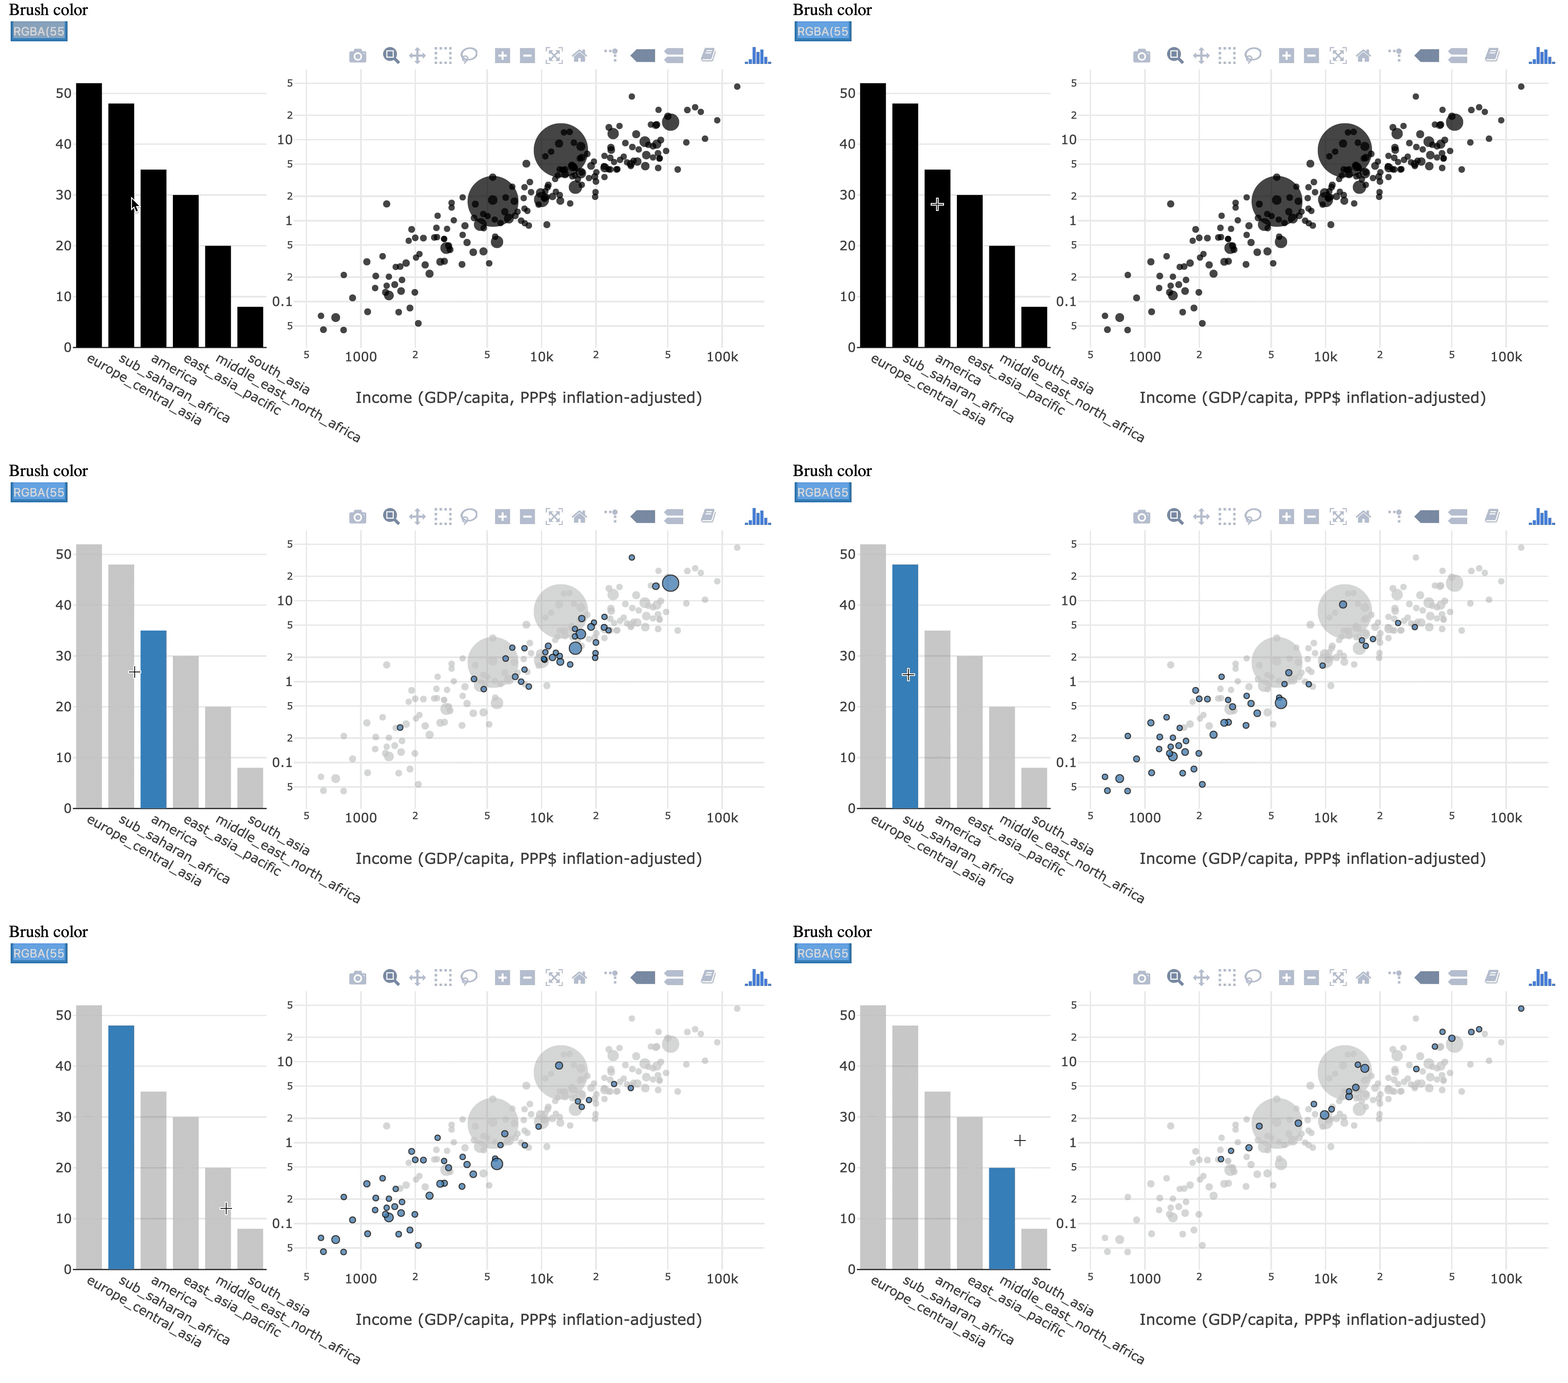
두 가지 선택 전략
일시적 선택

이전에 선택한 항목을 잊습니다

linking_teaser1.gif

지속 선택

선택한 항목이 누적됩니다

linking_teaser2.gif

R로 배우는 plotly 중급 인터랙티브 데이터 시각화

예시

지속_선택_전.png

R로 배우는 plotly 중급 인터랙티브 데이터 시각화

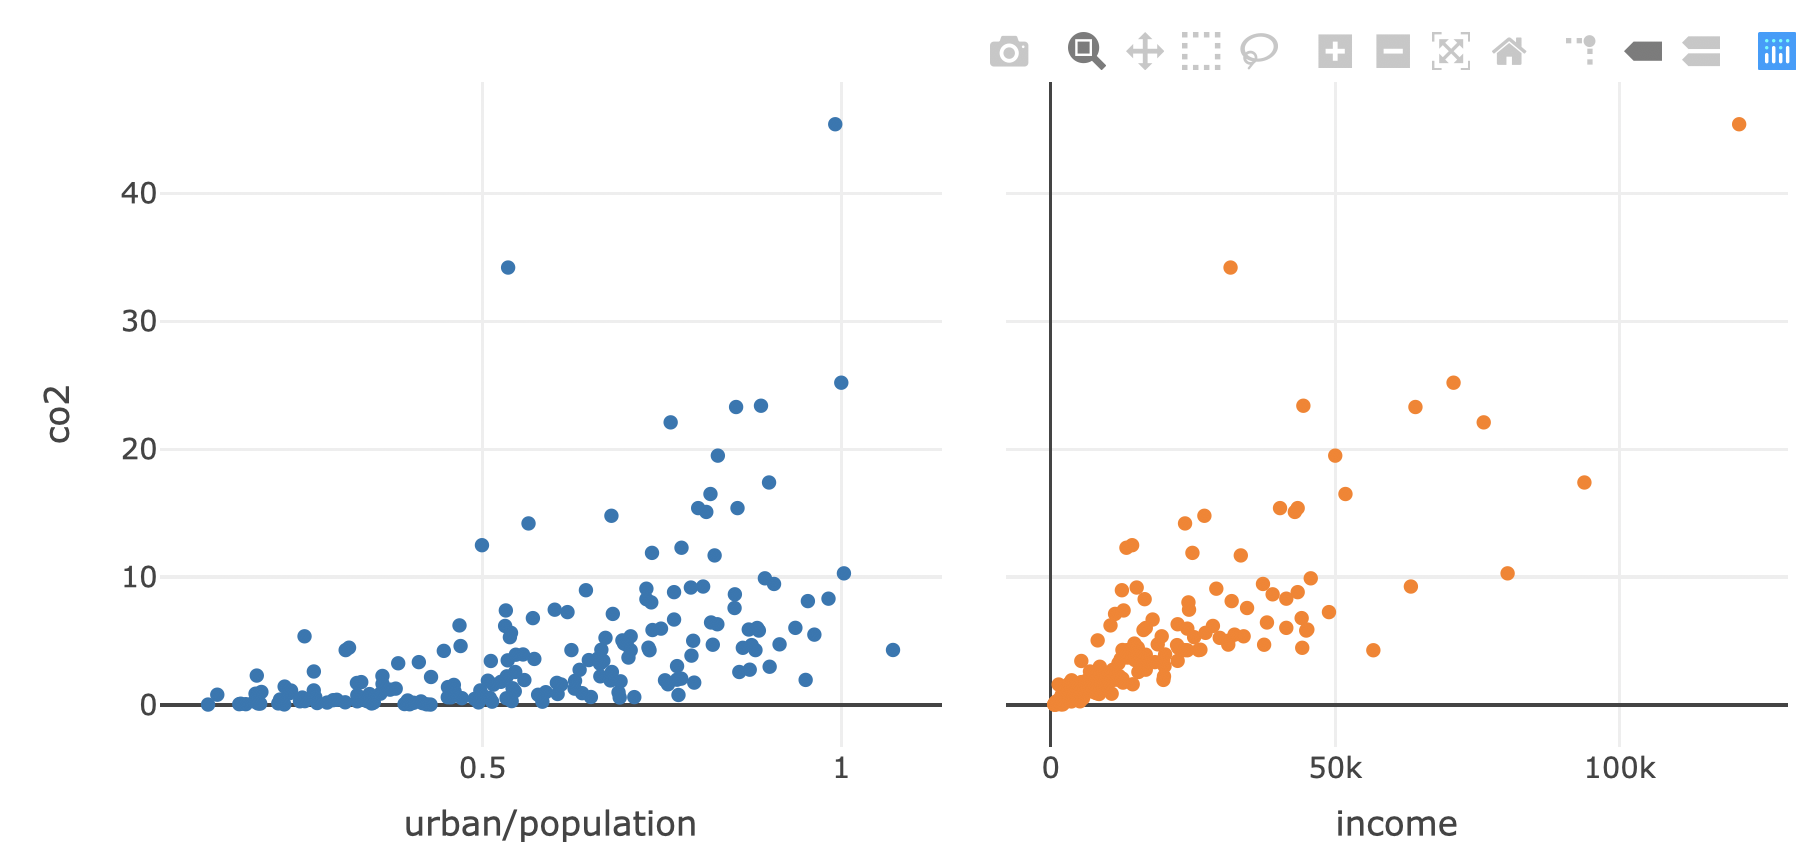
기본 차트 생성

shared_data <- world2014 %>% SharedData$new()

p1 <- shared_data %>%
  plot_ly(x=~urban/population, y = ~co2, text = ~country) %>%
  add_markers()

p2 <- shared_data %>%
  plot_ly(x=~income, y = ~co2, text = ~country) %>%
  add_markers()

subplot(p1, p2, titleX = TRUE, shareY = TRUE) %>% 
  hide_legend()
R로 배우는 plotly 중급 인터랙티브 데이터 시각화

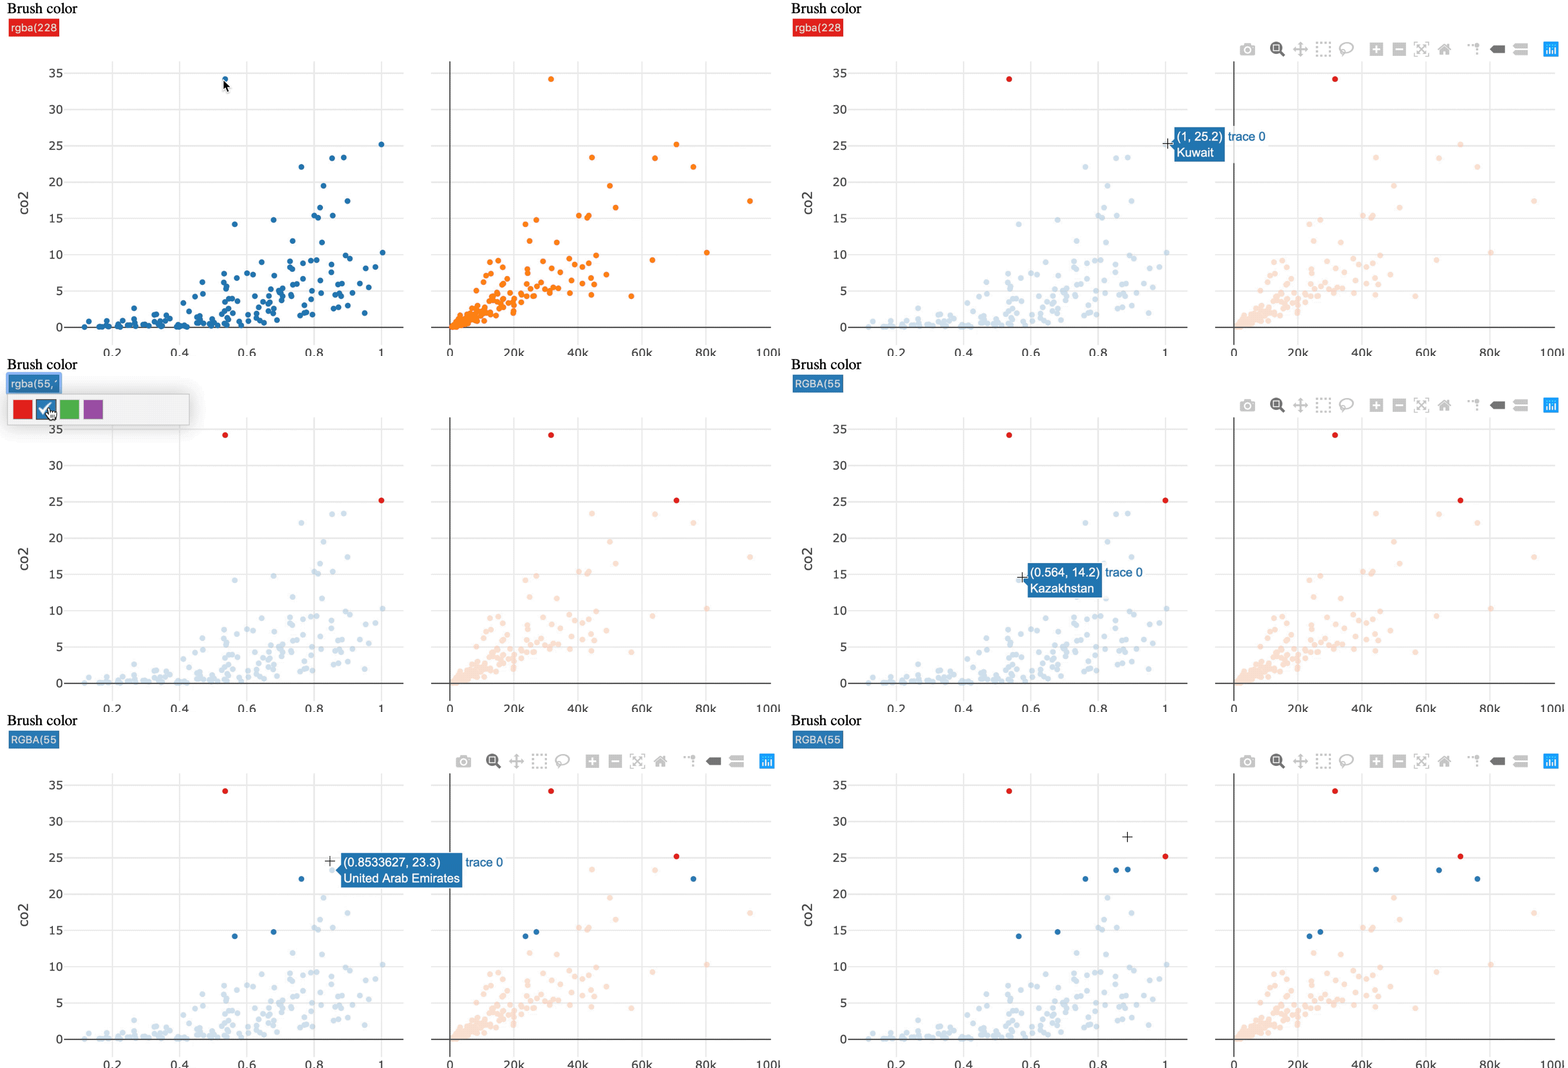
지속 선택

highlight()로 지속 선택 활성화

subplot(p1, p2, titleX = TRUE, shareY = TRUE) %>% 
  hide_legend() %>%
  highlight(persistent = TRUE)
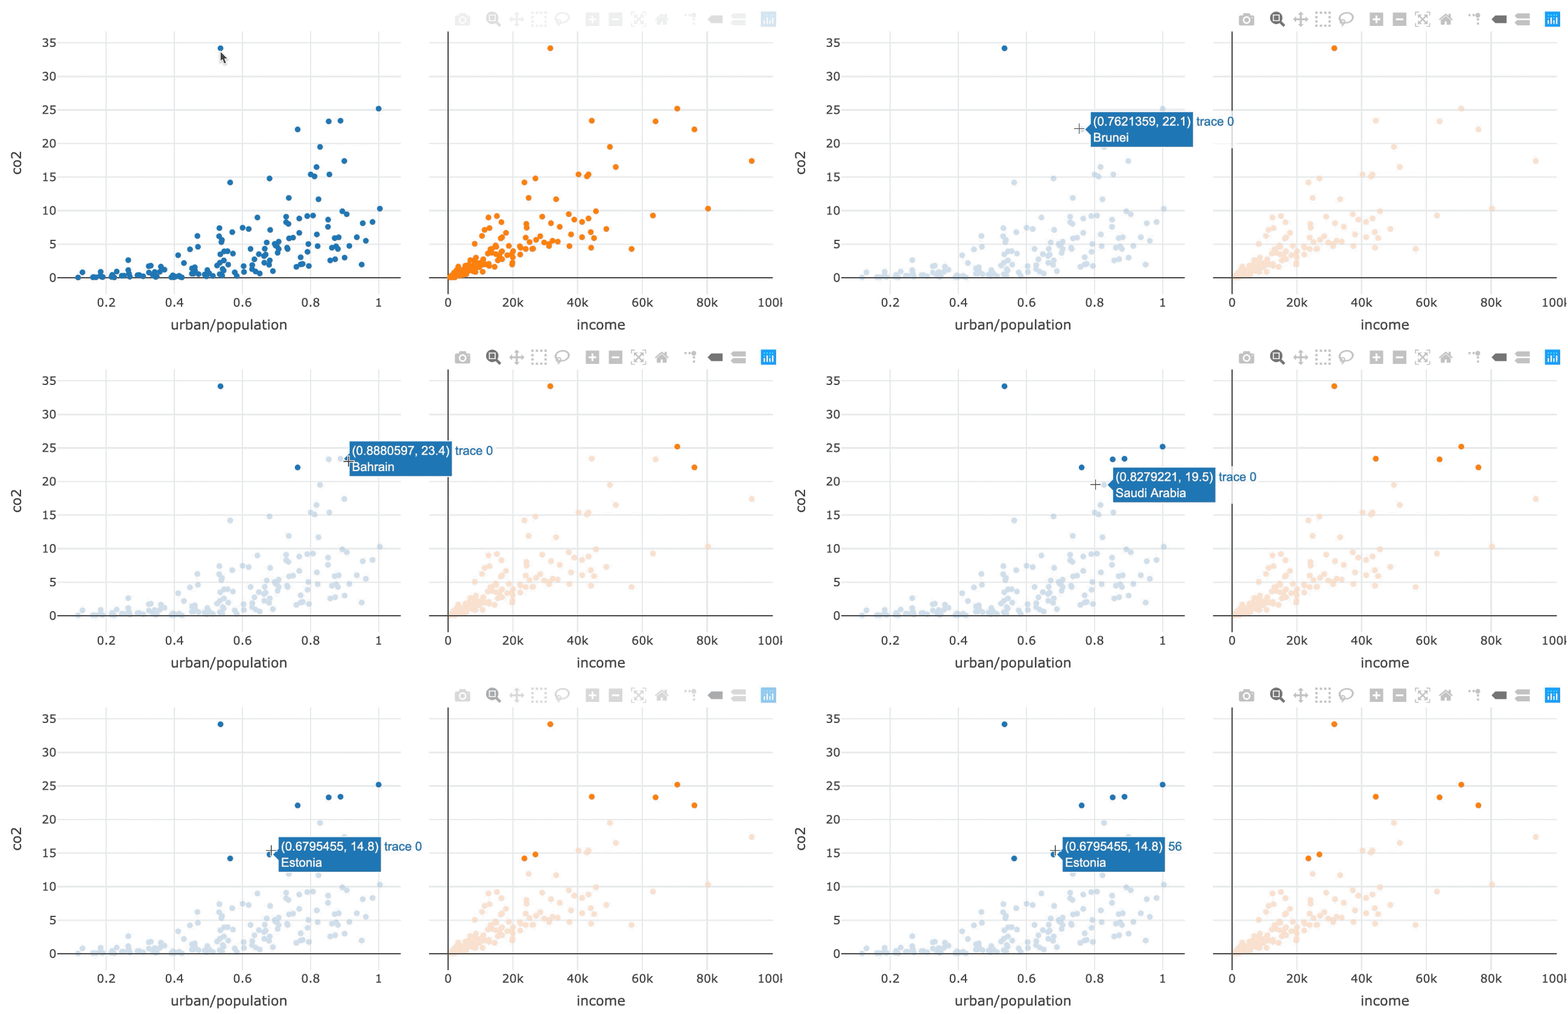
지속_선택.gif

R로 배우는 plotly 중급 인터랙티브 데이터 시각화

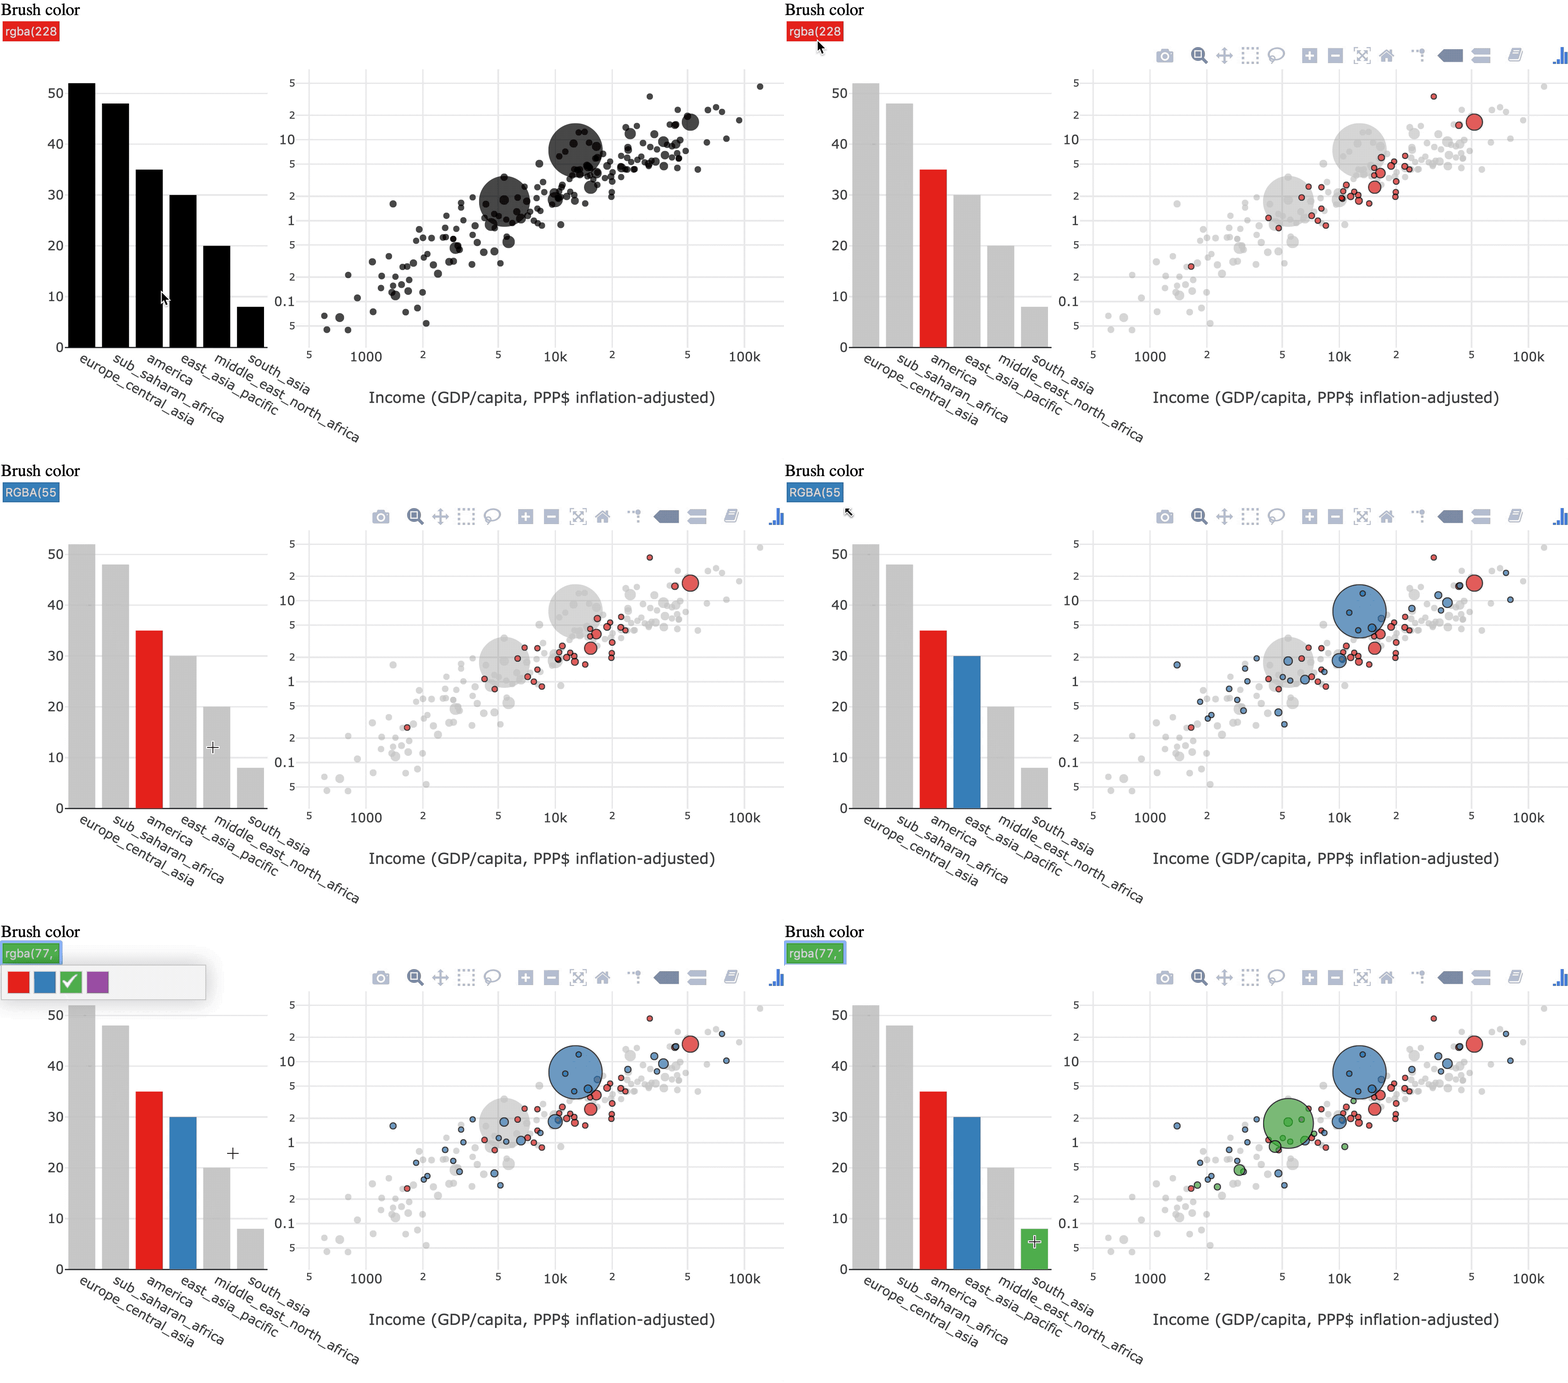
색상으로 강조 표시

색상_강조_동적.gif

R로 배우는 plotly 중급 인터랙티브 데이터 시각화

색상으로 강조 표시

색상 선택기를 켜려면 dynamic = TRUE 추가

subplot(p1, p2, titleX = TRUE, shareY = TRUE) %>% 
  hide_legend() %>%
  highlight(persistent = TRUE, dynamic = TRUE)
R로 배우는 plotly 중급 인터랙티브 데이터 시각화

두 가지 조작 방식

직접 조작

도형과 상호작용하여 선택합니다

linking_teaser1.gif

간접 조작

차트 밖의 질의를 통해 선택합니다

indirect_manipulation.gif

R로 배우는 plotly 중급 인터랙티브 데이터 시각화

시계열_선택_어려움.gif

R로 배우는 plotly 중급 인터랙티브 데이터 시각화

간접 조작

world_indicators %>%
  SharedData$new(key = ~country) %>% 
  plot_ly(x = ~year, y = ~income, alpha = 0.5) %>%
  group_by(country) %>%
  add_lines()
R로 배우는 plotly 중급 인터랙티브 데이터 시각화

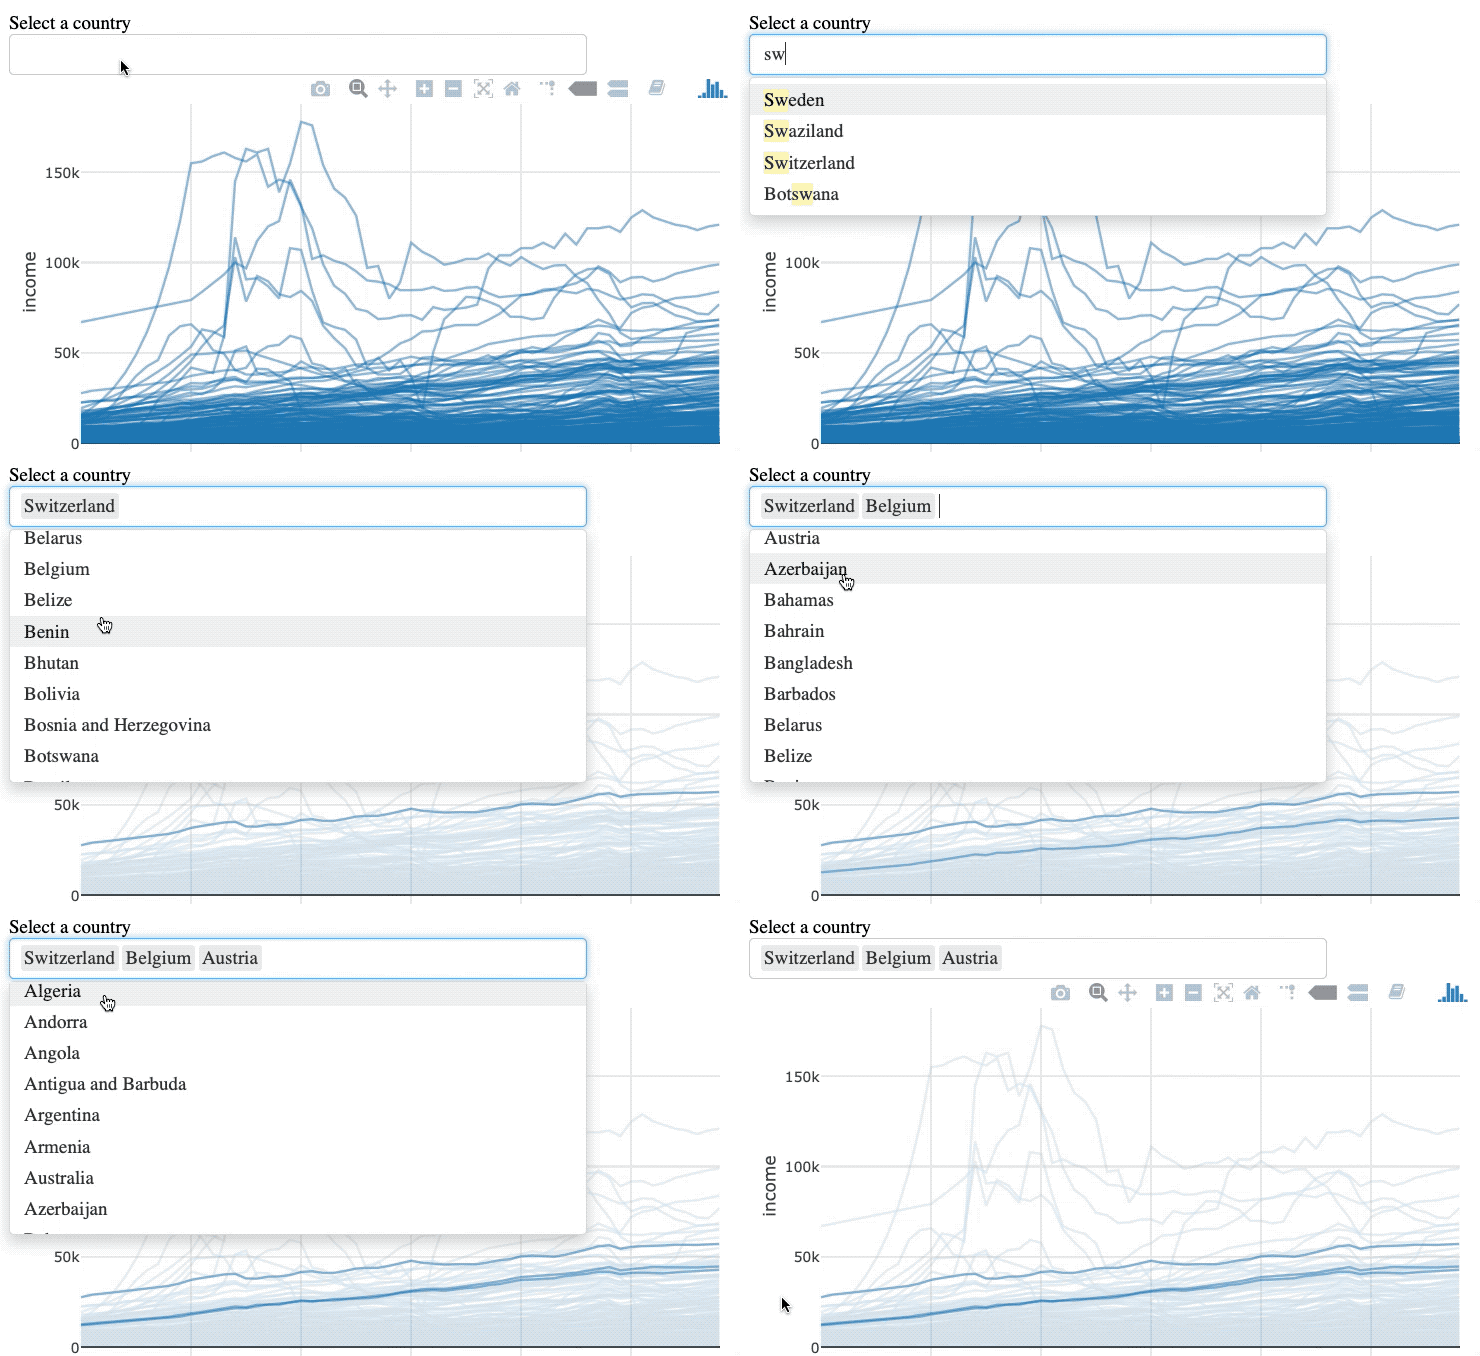
간접 조작

world_indicators %>%
  SharedData$new(key = ~country, group = "Select a country") %>% 
  plot_ly(x = ~year, y = ~income, alpha = 0.5) %>%
  group_by(country) %>%
  add_lines() %>%
  highlight(selectize = TRUE)
R로 배우는 plotly 중급 인터랙티브 데이터 시각화

간접_조작.gif

R로 배우는 plotly 중급 인터랙티브 데이터 시각화

연습해 봅시다!

R로 배우는 plotly 중급 인터랙티브 데이터 시각화

Preparing Video For Download...