누적 애니메이션

R로 배우는 plotly 중급 인터랙티브 데이터 시각화

Adam Loy

Statistician, Carleton College
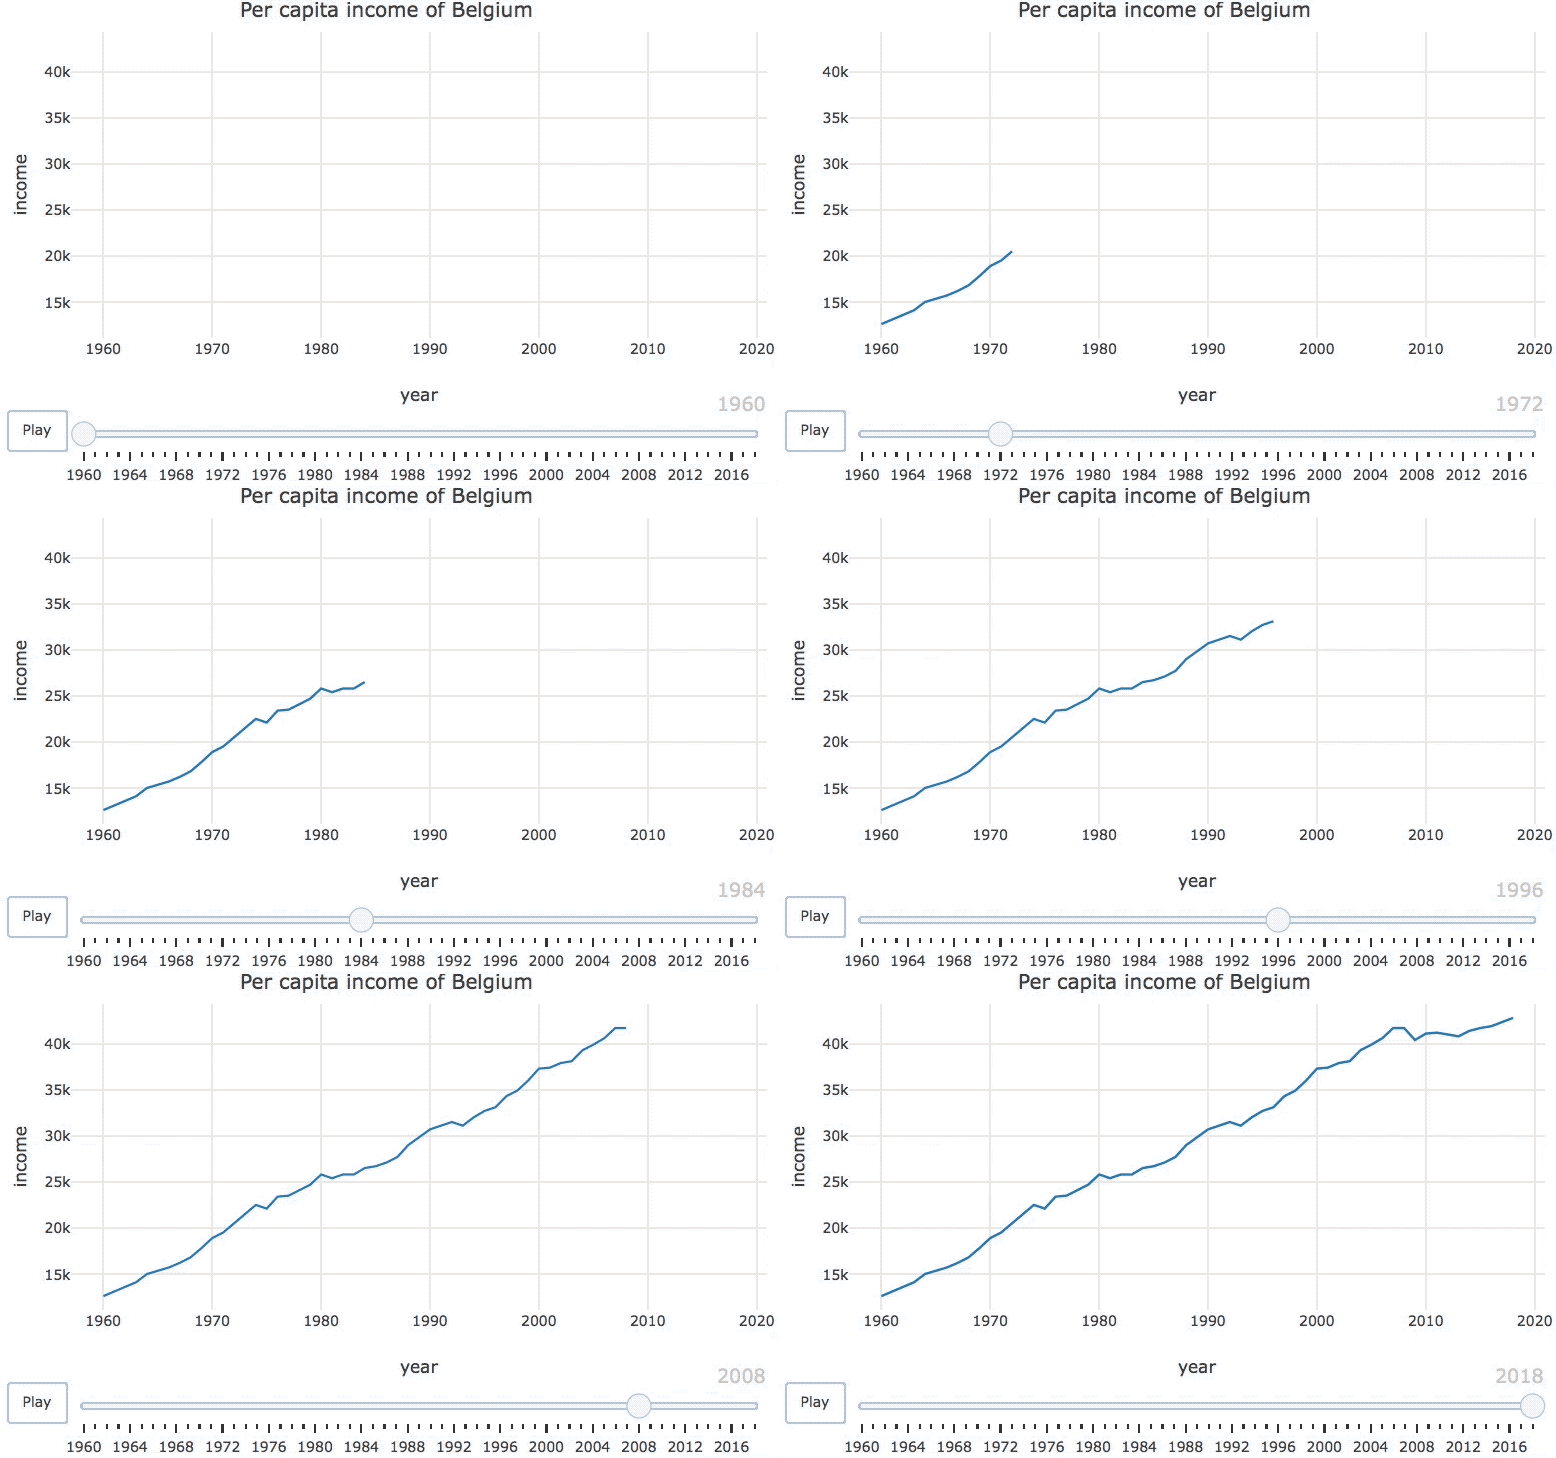
벨기에 1인당 소득 시계열 애니메이션.

R로 배우는 plotly 중급 인터랙티브 데이터 시각화

벨기에 소득 데이터

belgium <- world_indicators %>%
  filter(country == "Belgium")
belgium
# A tibble: 59 x 11
  country  year income   co2 military population  urban life_expectancy four_regions
  <chr>   <dbl>  <dbl> <dbl>    <dbl>      <dbl>  <dbl>           <dbl> <chr>       
1 Belgium  1960  12600  9.93     3.4     9170000 8.46e6            69.6 europe      
2 Belgium  1961  13100 10.1      3.26    9230000 8.50e6            70.5 europe      
3 Belgium  1962  13700 10.6      3.28    9280000 8.55e6            70.2 europe      
4 Belgium  1963  14100 11.3      3.22    9340000 8.62e6            70   europe      
5 Belgium  1964  15000 11        3.21    9390000 8.72e6            70.7 europe      
# … with 54 more rows, and 2 more variables: eight_regions <chr>, six_regions <chr>
R로 배우는 plotly 중급 인터랙티브 데이터 시각화

프레임이란?

# A tibble: 59 x 11
  country  year income   co2
  <chr>   <dbl>  <dbl> <dbl>
1 Belgium  1960  12600  9.93
2 Belgium  1961  13100 10.1 
3 Belgium  1962  13700 10.6 
4 Belgium  1963  14100 11.3 
5 Belgium  1964  15000 11   
6 Belgium  1965  15300 11.2 
# … with 53 more rows, and 7
#   more variables

frame = ~year는 무엇을 의미하나요?

R로 배우는 plotly 중급 인터랙티브 데이터 시각화

프레임이란?

목표 프레임 간 지속 정보를 설명

frame = ~year frame = ~year를 설정하면 지속 데이터가 없음.

R로 배우는 plotly 중급 인터랙티브 데이터 시각화

데이터 누적하기

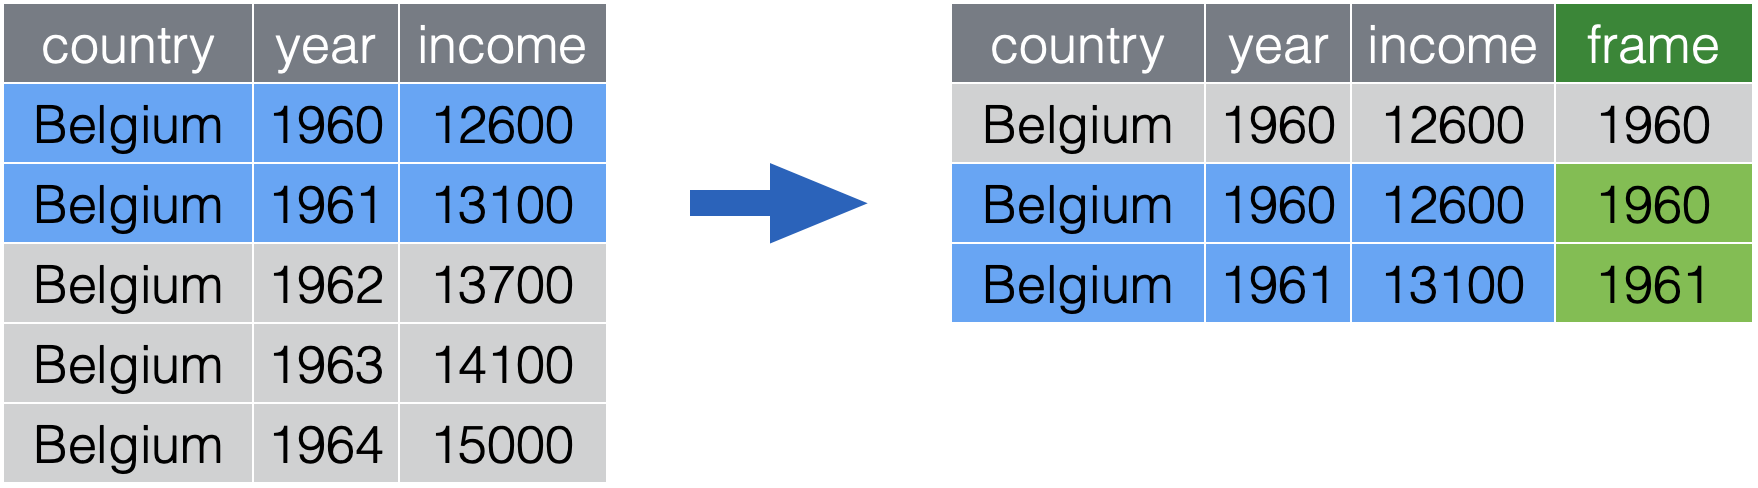
1960년까지 누적된 데이터 프레임.

R로 배우는 plotly 중급 인터랙티브 데이터 시각화

데이터 누적하기

1961년까지 누적된 데이터 프레임.

R로 배우는 plotly 중급 인터랙티브 데이터 시각화

데이터 누적하기

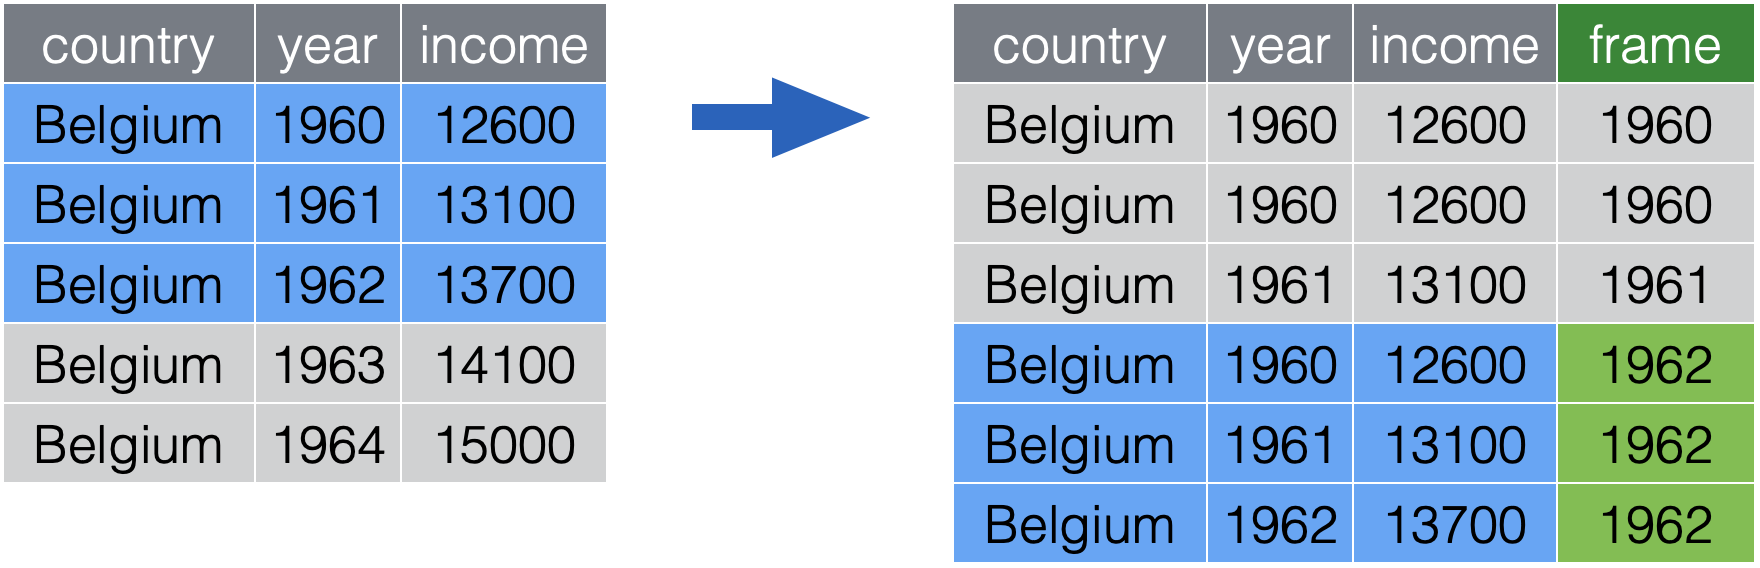
1962년까지 누적된 데이터 프레임.

R로 배우는 plotly 중급 인터랙티브 데이터 시각화

split()

library(dplyr)
library(purrr)

belgium %>% split(.$year)

year 변수로 데이터셋을 분리하여 데이터 프레임 리스트로 만들기

R로 배우는 plotly 중급 인터랙티브 데이터 시각화

accumulate()

library(dplyr)
library(purrr)
belgium %>%
  split(.$year) %>%
  accumulate(~bind_rows(.x, .y)) 

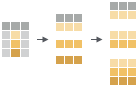
단일 행 데이터 프레임을 재귀적으로 바인딩하는 이미지.

R로 배우는 plotly 중급 인터랙티브 데이터 시각화

이름 지정

library(dplyr)
library(purrr)
belgium %>%
  split(.$year) %>%
  accumulate(~bind_rows(.x, .y)) %>%
  set_names(1960:2018) 

단일 행 데이터 프레임을 재귀적으로 바인딩하는 이미지.

R로 배우는 plotly 중급 인터랙티브 데이터 시각화

결합

library(dplyr)
library(purrr)
belgium %>%
  split(.$year) %>%
  accumulate(~bind_rows(.x, .y)) %>%
  set_names(1960:2018) %>%
  bind_rows(.id = "frame")

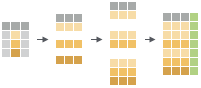
데이터 프레임 리스트를 행 기준으로 결합하는 이미지.

R로 배우는 plotly 중급 인터랙티브 데이터 시각화
# A tibble: 1,770 x 12
   frame country  year income   co2 military population  urban life_expectancy
   <chr> <chr>   <dbl>  <dbl> <dbl>    <dbl>      <dbl>  <dbl>           <dbl>
 1 1960  Belgium  1960  12600  9.93     3.4     9170000 8.46e6            69.6
 2 1961  Belgium  1960  12600  9.93     3.4     9170000 8.46e6            69.6
 3 1961  Belgium  1961  13100 10.1      3.26    9230000 8.50e6            70.5
 4 1962  Belgium  1960  12600  9.93     3.4     9170000 8.46e6            69.6
 5 1962  Belgium  1961  13100 10.1      3.26    9230000 8.50e6            70.5
 6 1962  Belgium  1962  13700 10.6      3.28    9280000 8.55e6            70.2
 7 1963  Belgium  1960  12600  9.93     3.4     9170000 8.46e6            69.6
 8 1963  Belgium  1961  13100 10.1      3.26    9230000 8.50e6            70.5
 9 1963  Belgium  1962  13700 10.6      3.28    9280000 8.55e6            70.2
10 1963  Belgium  1963  14100 11.3      3.22    9340000 8.62e6            70  
# … with 1,760 more rows, and 3 more variables: four_regions <chr>,
#   eight_regions <chr>, six_regions <chr>
R로 배우는 plotly 중급 인터랙티브 데이터 시각화

애니메이트

library(dplyr)
library(purrr)
belgium %>%
  split(.$year) %>%
  accumulate(~bind_rows(.x, .y)) %>%
  set_names(1960:2018) %>%
  bind_rows(.id = "frame") %>%
  plot_ly(x = ~year, y = ~income) %>%
  add_lines(
    frame = ~frame, showlegend = FALSE
  )

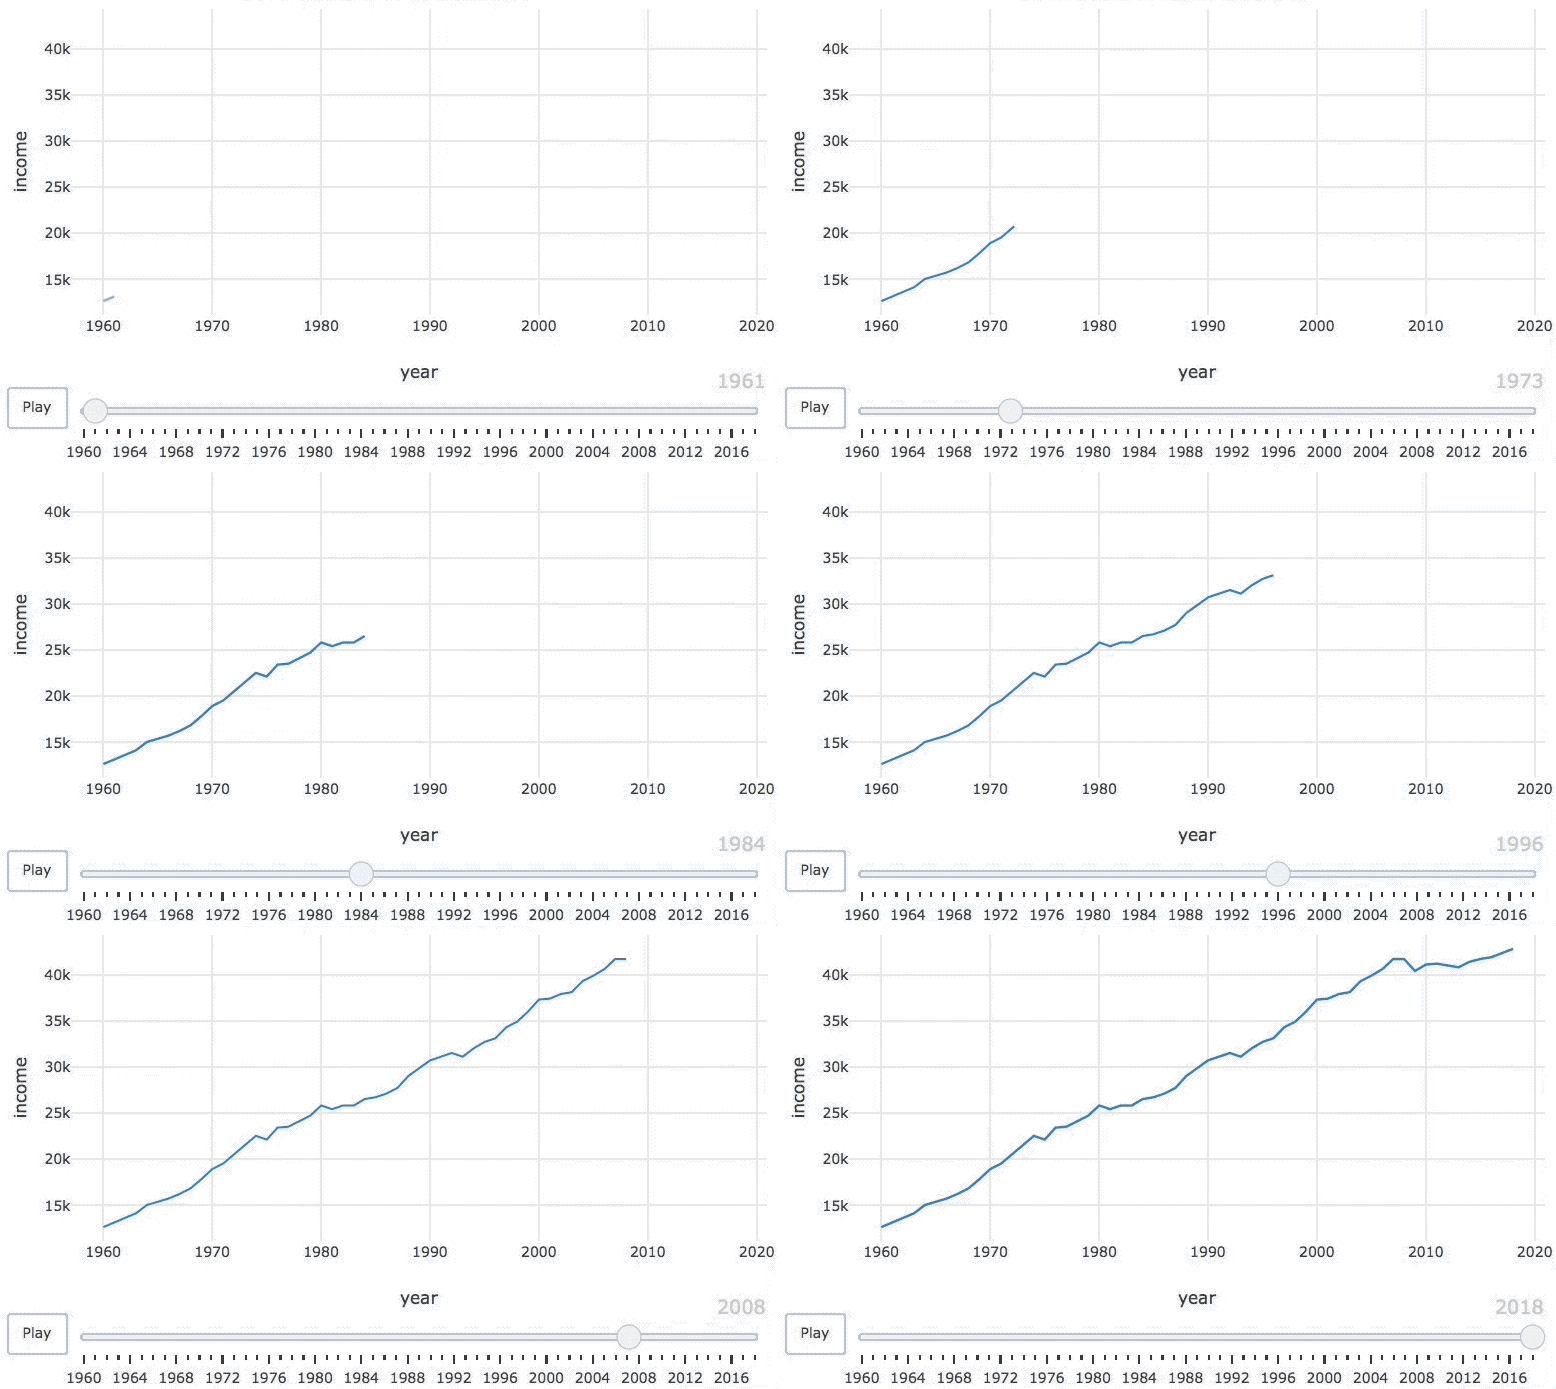
시간에 따른 벨기에 1인당 소득 애니메이션.

R로 배우는 plotly 중급 인터랙티브 데이터 시각화

연습해 봅시다!

R로 배우는 plotly 중급 인터랙티브 데이터 시각화

Preparing Video For Download...