요약: 애니메이션

R로 배우는 plotly 중급 인터랙티브 데이터 시각화

Adam Loy

Statistician, Carleton College

키프레임 애니메이션

산점도 필름스트립.

world_indicators %>%
  plot_ly(x = ~income, y = ~co2) %>%
  add_markers(frame = ~year, ids = ~country, showlegend = FALSE)
R로 배우는 plotly 중급 인터랙티브 데이터 시각화

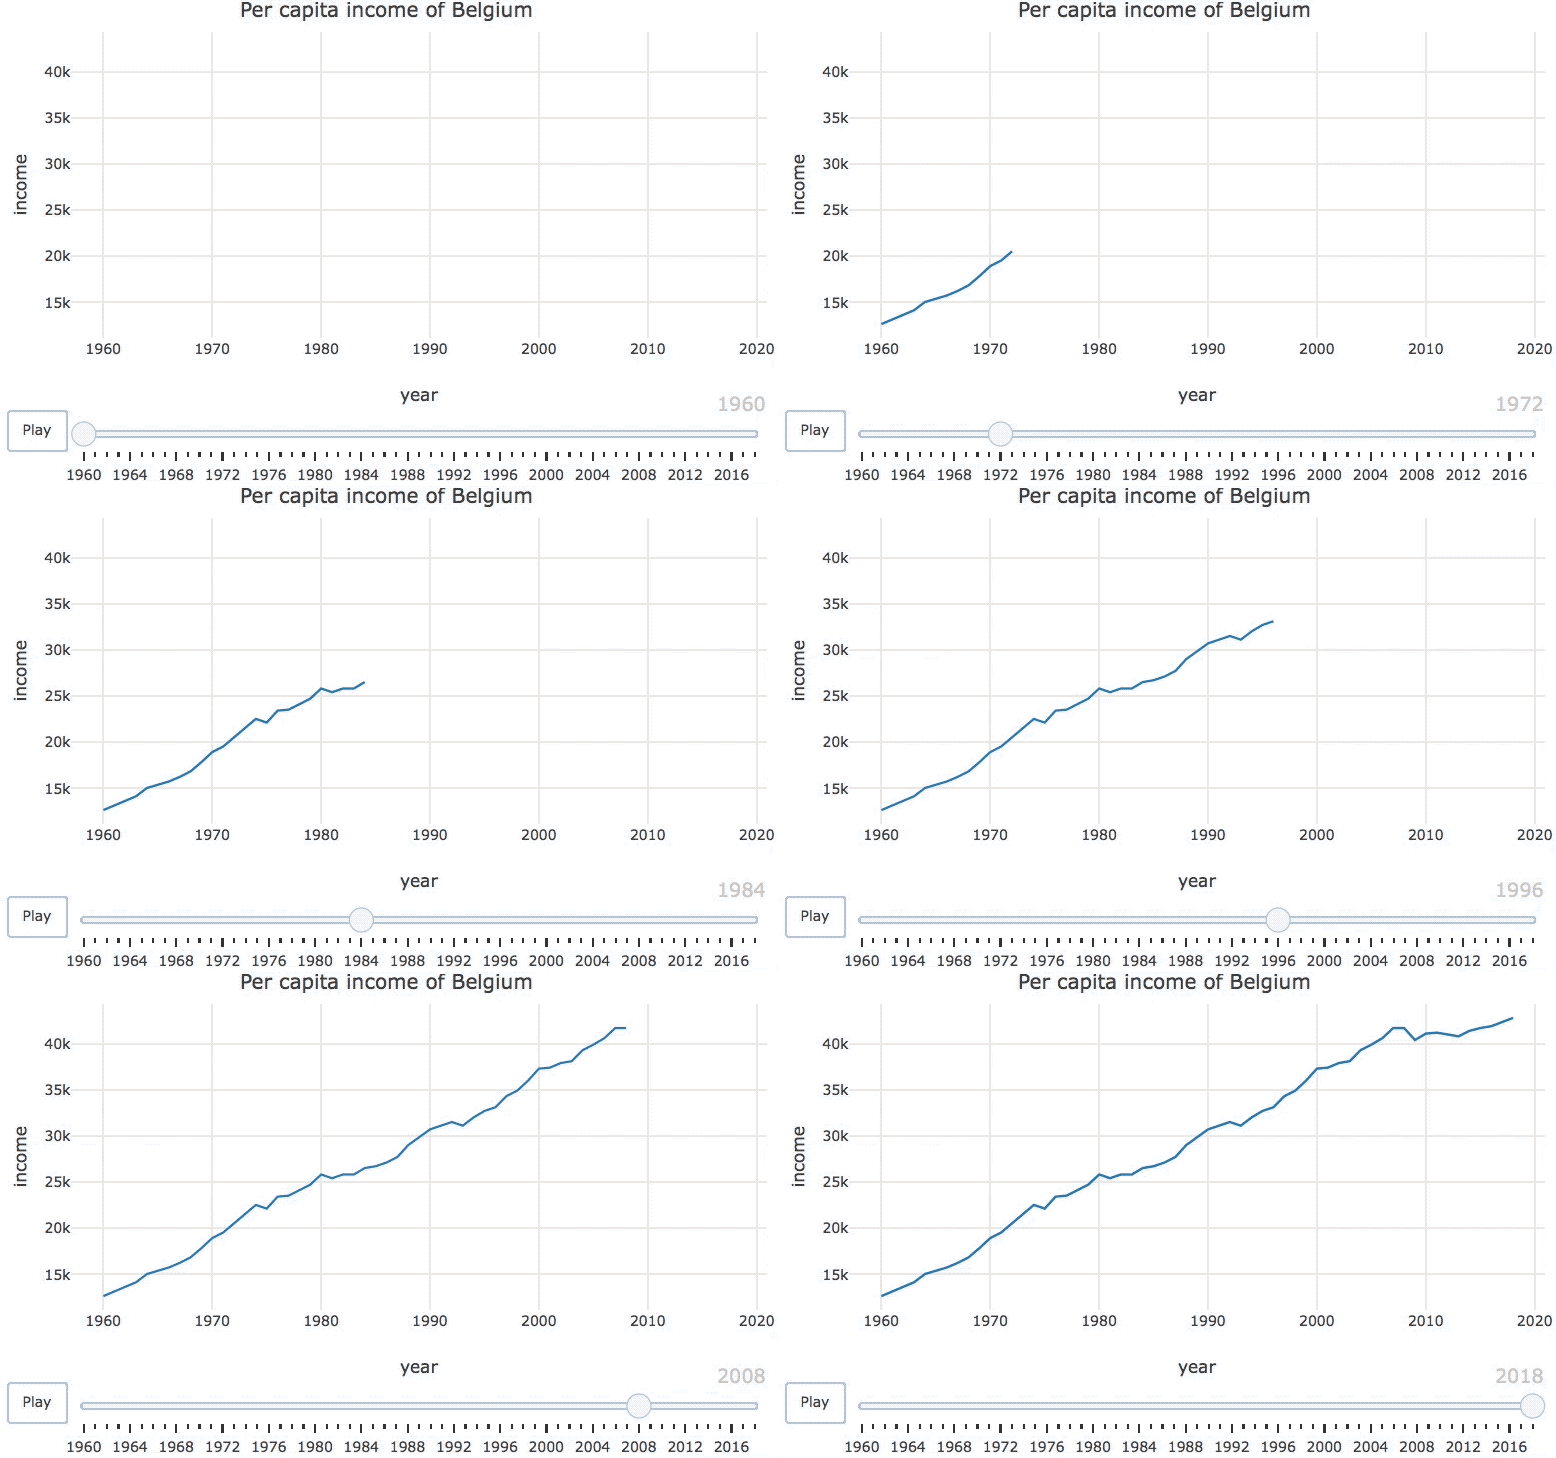
벨기에 1인당 소득 시계열 애니메이션.

R로 배우는 plotly 중급 인터랙티브 데이터 시각화

누적 애니메이션

library(dplyr)
library(purrr)
belgium %>%
  split(.$year) %>%
  accumulate(~bind_rows(.x, .y)) %>%
  set_names(1960:2018) %>%
  bind_rows(.id = "frame")
R로 배우는 plotly 중급 인터랙티브 데이터 시각화

시작 시점이 다른 경우 처리하기

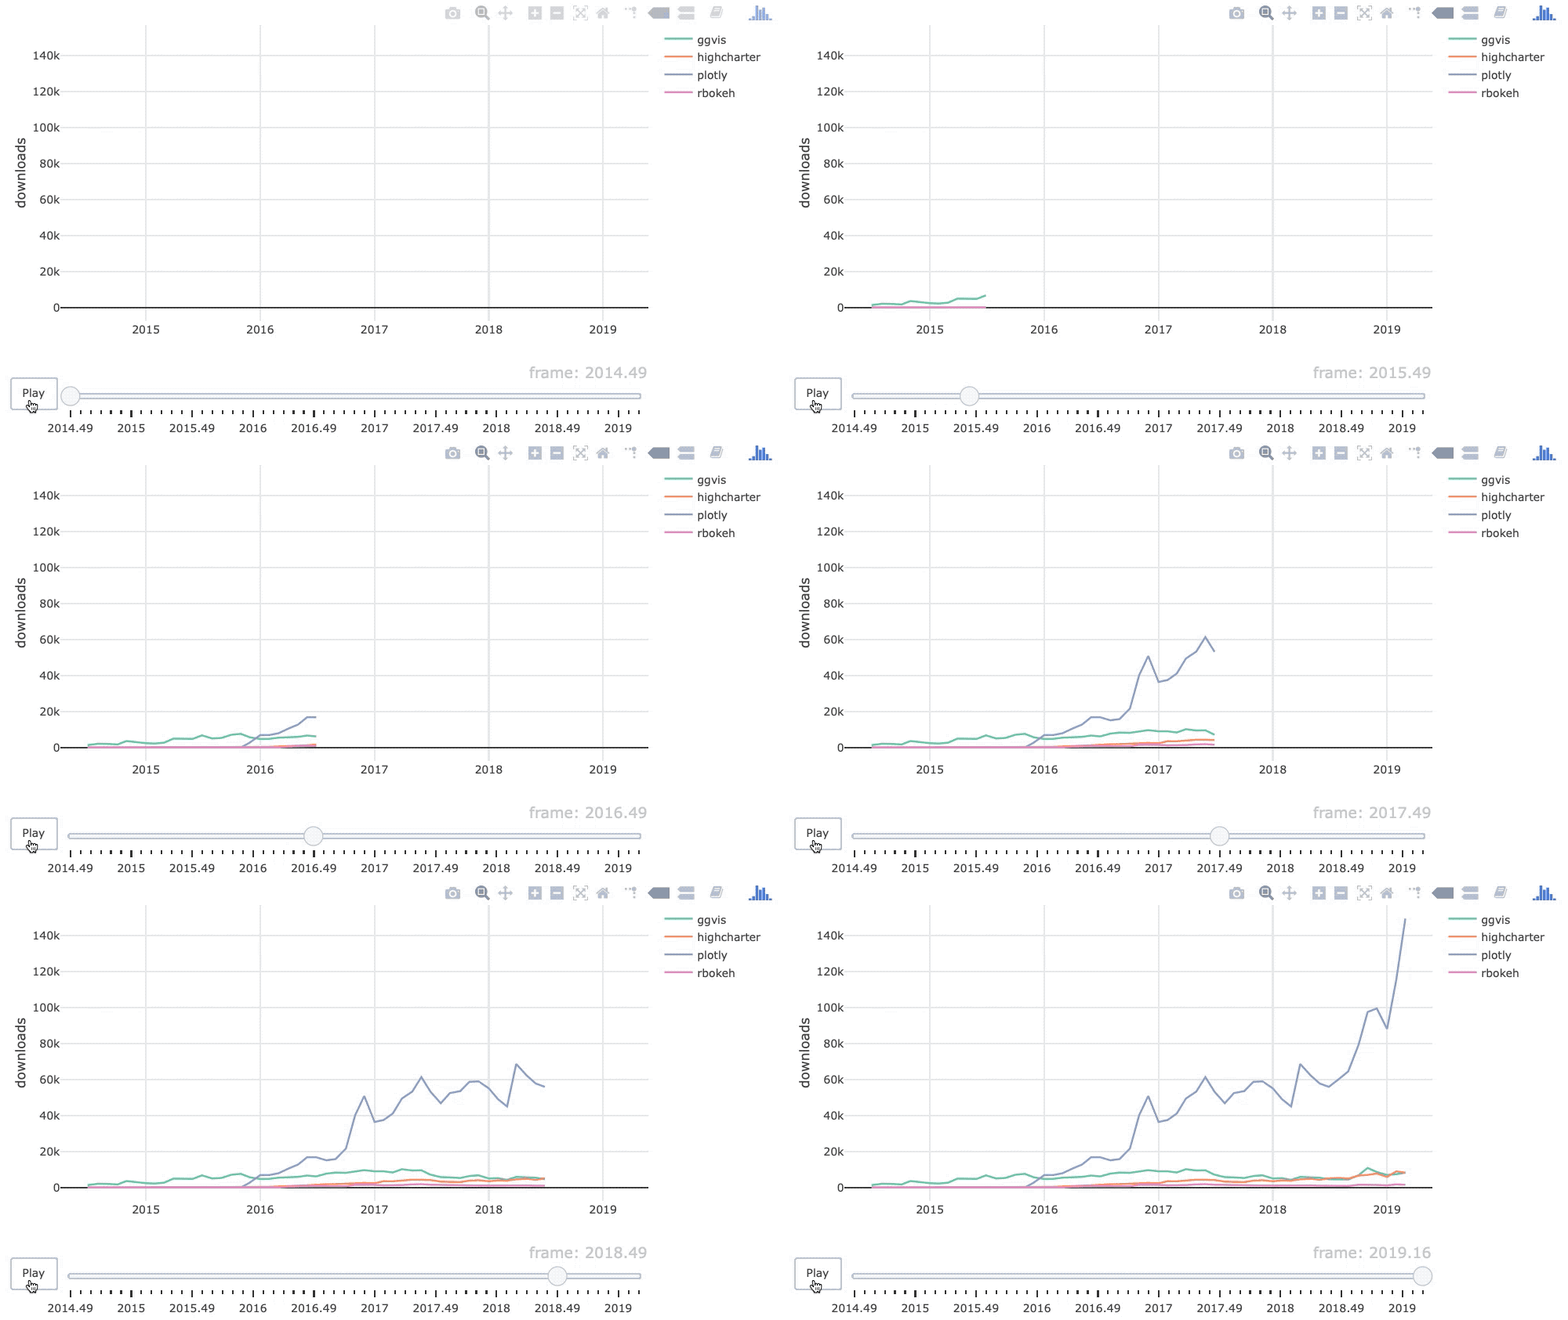
계단식 시작점을 처리한 CRAN 로그 애니메이션.

R로 배우는 plotly 중급 인터랙티브 데이터 시각화

CRAN 다운로드 데이터

glimpse(monthly_logs)
Rows: 171
Columns: 4
$ package   <chr> "ggvis", "ggvis", "ggvis", "ggvis", "ggvis", "ggvis",…
$ date      <date> 2014-06-30, 2014-07-31, 2014-08-31, 2014-09-30, 2014…
$ dec_date  <dbl> 2014.49, 2014.58, 2014.66, 2014.75, 2014.83, 2014.91,…
$ downloads <dbl> 1344, 2120, 2035, 1702, 3590, 2899, 2427, 2227, 2708,…
R로 배우는 plotly 중급 인터랙티브 데이터 시각화

베이스라인 문제를 무시하면?

monthly_logs %>%
  split(f = .$dec_date) %>%
  accumulate(., ~bind_rows(.x, .y)) %>%
  bind_rows(.id = "frame") %>%
  plot_ly(x = ~dec_date, y = ~downloads) %>%
  add_lines(color = ~package, frame = ~frame, ids = ~package)
Warning message:
In p$x$data[firstFrame] <- p$x$frames[[1]]$data :
  number of items to replace is not a multiple of replacement length
R로 배우는 plotly 중급 인터랙티브 데이터 시각화

데이터 세트 보완하기

library(tidyr)
complete_logs <- monthly_logs %>% complete(package, dec_date, fill = list(downloads = 0))

arrange(complete_logs, dec_date)
## A tibble: 228 x 4
  package     dec_date date       downloads
  <chr>          <dbl> <date>         <dbl>
1 ggvis          2014. 2014-06-30      1344
2 highcharter    2014. NA                 0
3 plotly         2014. NA                 0
4 rbokeh         2014. NA                 0
5 ggvis          2015. 2014-07-31      2120
# … with 223 more rows
R로 배우는 plotly 중급 인터랙티브 데이터 시각화

보완된 데이터로 애니메이션 만들기

complete_logs %>%
  split(f = .$dec_date) %>%
  accumulate(., ~bind_rows(.x, .y)) %>%
  bind_rows(.id = "frame") %>%
  plot_ly(x = ~dec_date, y = ~downloads) %>%
  add_lines(color = ~package, frame = ~frame, ids = ~package)

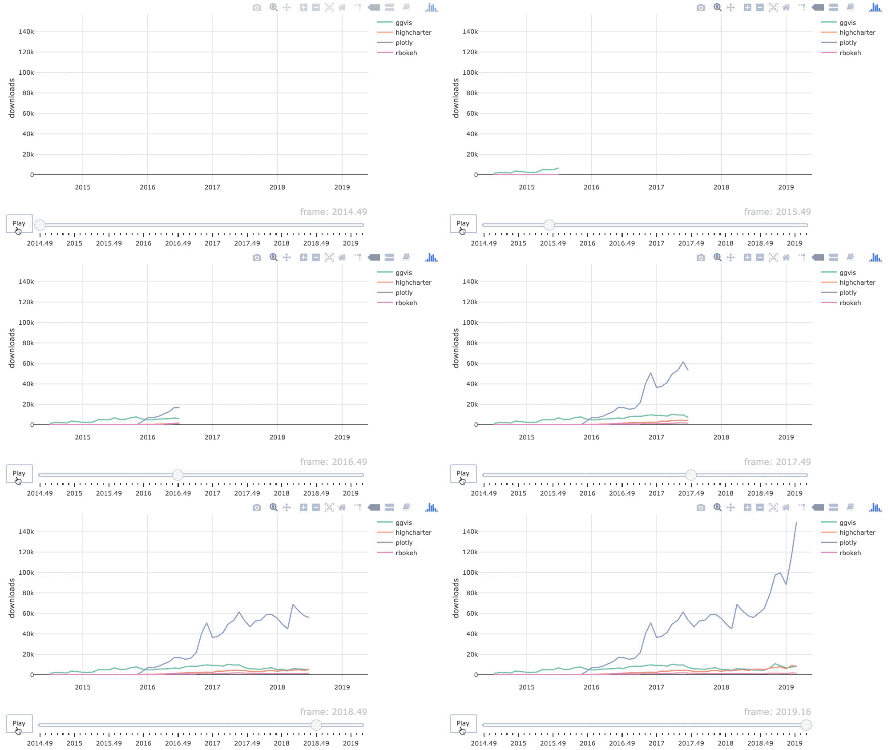
CRAN 로그 애니메이션(작음).

R로 배우는 plotly 중급 인터랙티브 데이터 시각화

연습해 봅시다!

R로 배우는 plotly 중급 인터랙티브 데이터 시각화

Preparing Video For Download...