R로 배우는 plotly 중급 인터랙티브 데이터 시각화
Adam Loy
Statistician, Carleton College
애니메이션 옵션
플로팅 옵션
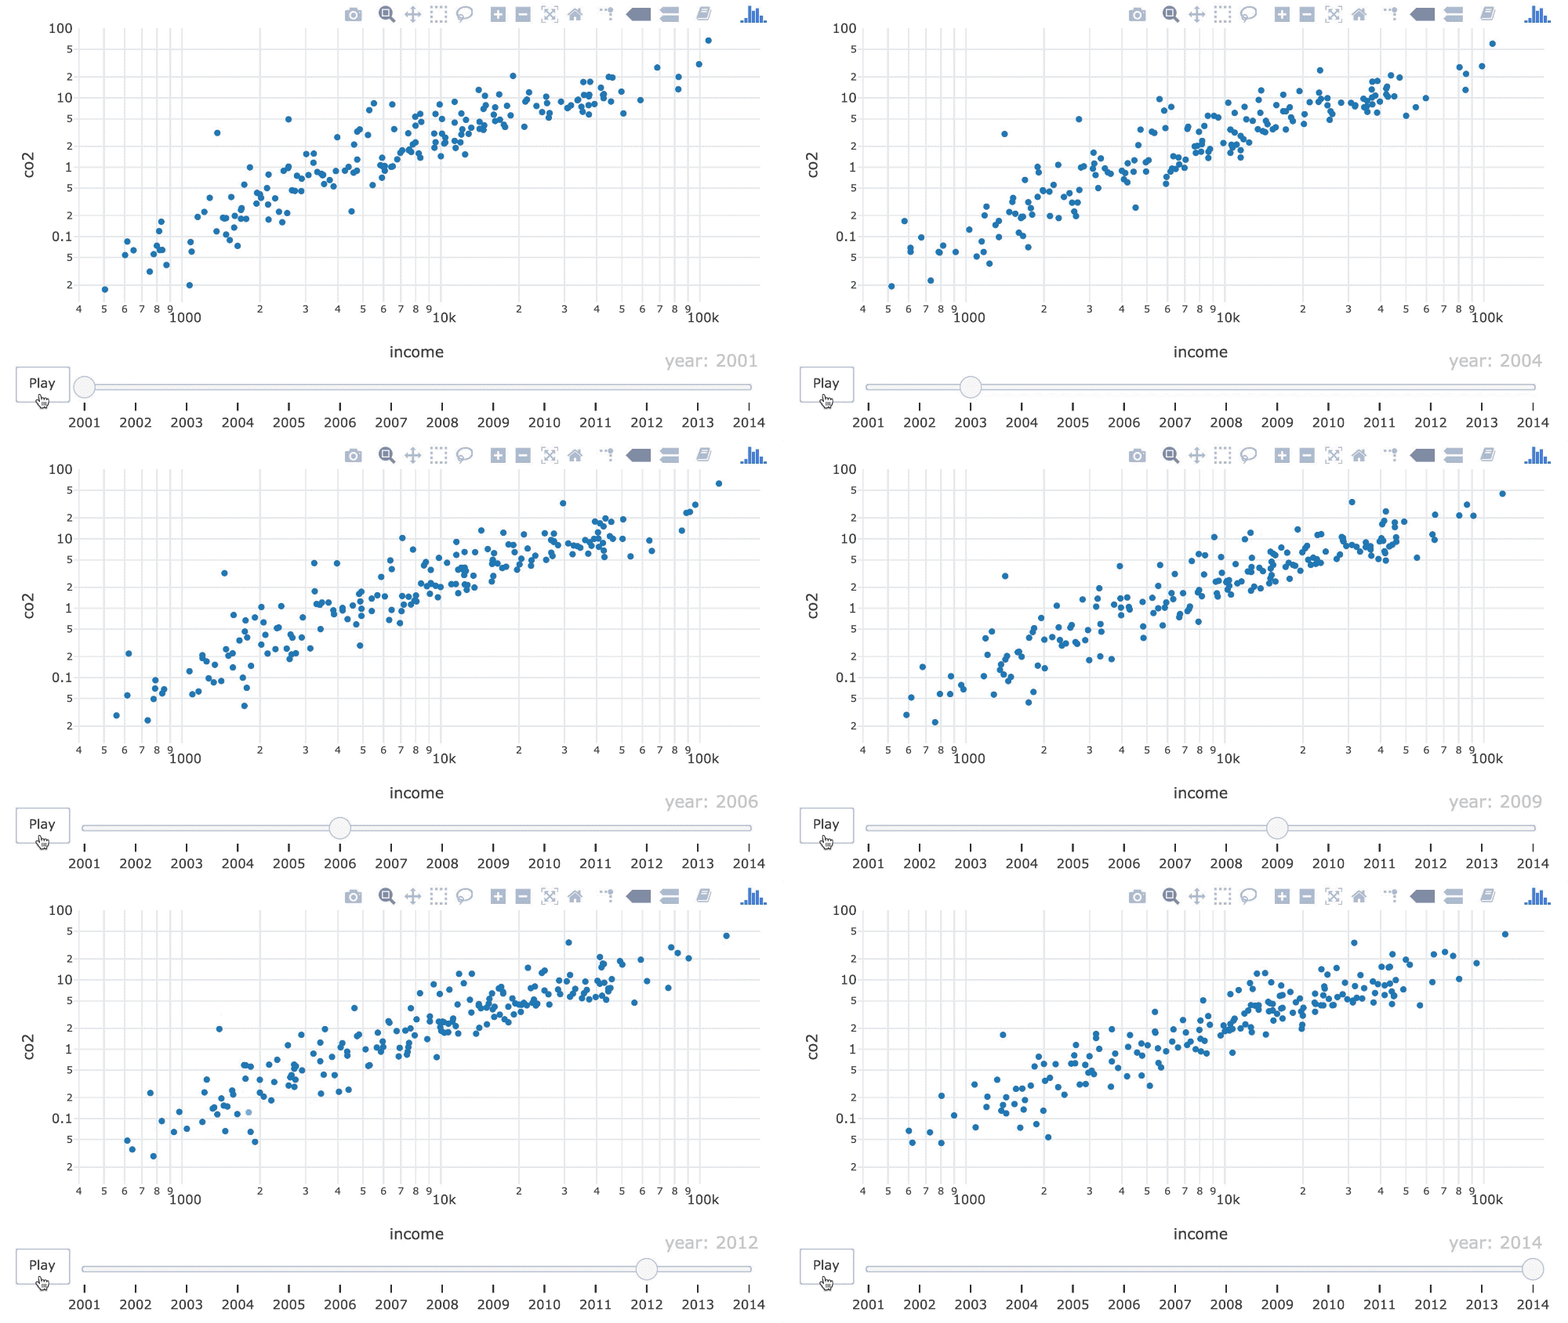
ani <- world_indicators %>%
  plot_ly(x = ~income, y = ~co2) %>%
  add_markers(frame = ~year,
              ids = ~country,
              showlegend = FALSE) %>%
  layout(xaxis = list(type = "log"),
         yaxis = list(type = "log"))
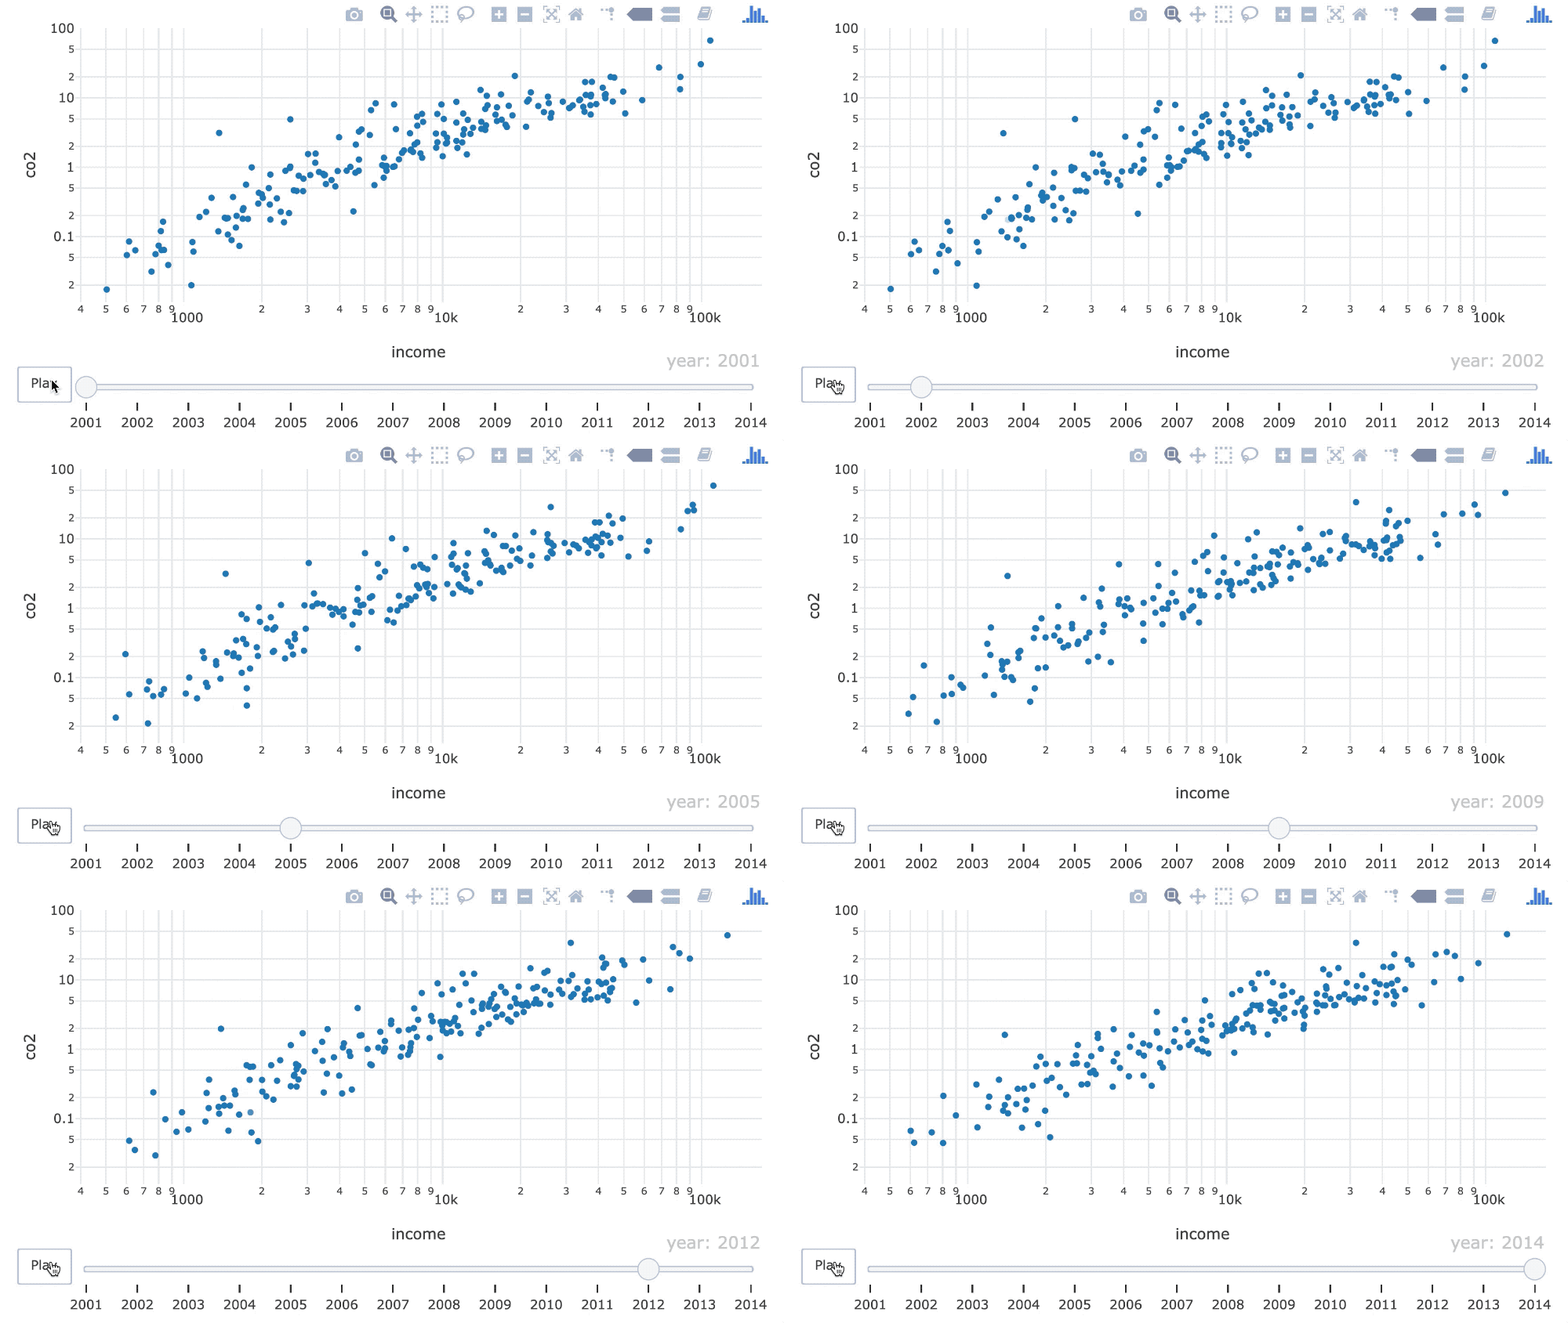
ani %>%
  animation_opts(
      frame = 500,
      transition = frame,
      easing = "linear",
      redraw = TRUE
   )
ani %>%
  animation_opts(frame = 300)
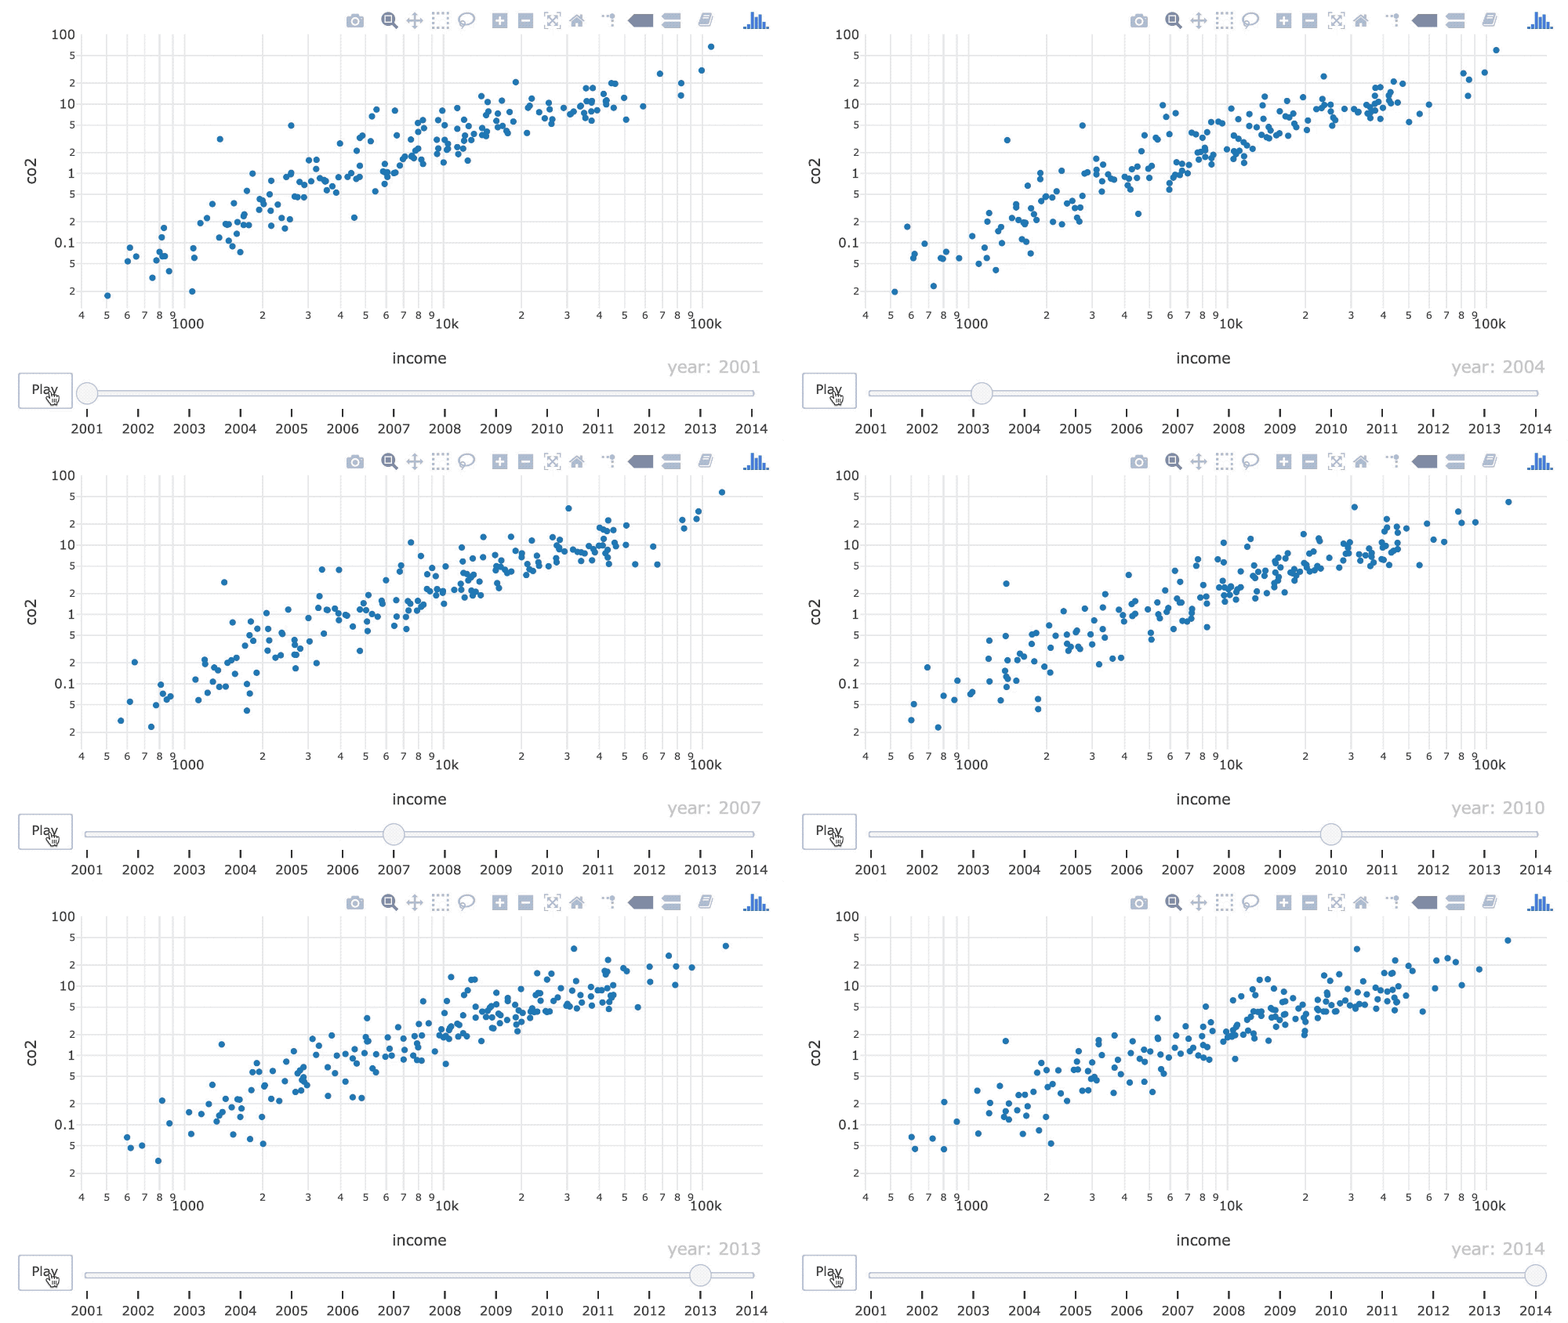
ani %>%
  animation_opts(
     frame = 700,
     transition = 350
  )
ani %>%
  animation_opts(easing = "bounce")
기본 easing 옵션:
"linear", "quad", "cubic", "sin", "exp", "circle", "elastic", "back", "bounce"
"linear"
"quad"
"cubic"
"sin"
"exp"
"circle"
"elastic"
"back"
"bounce"
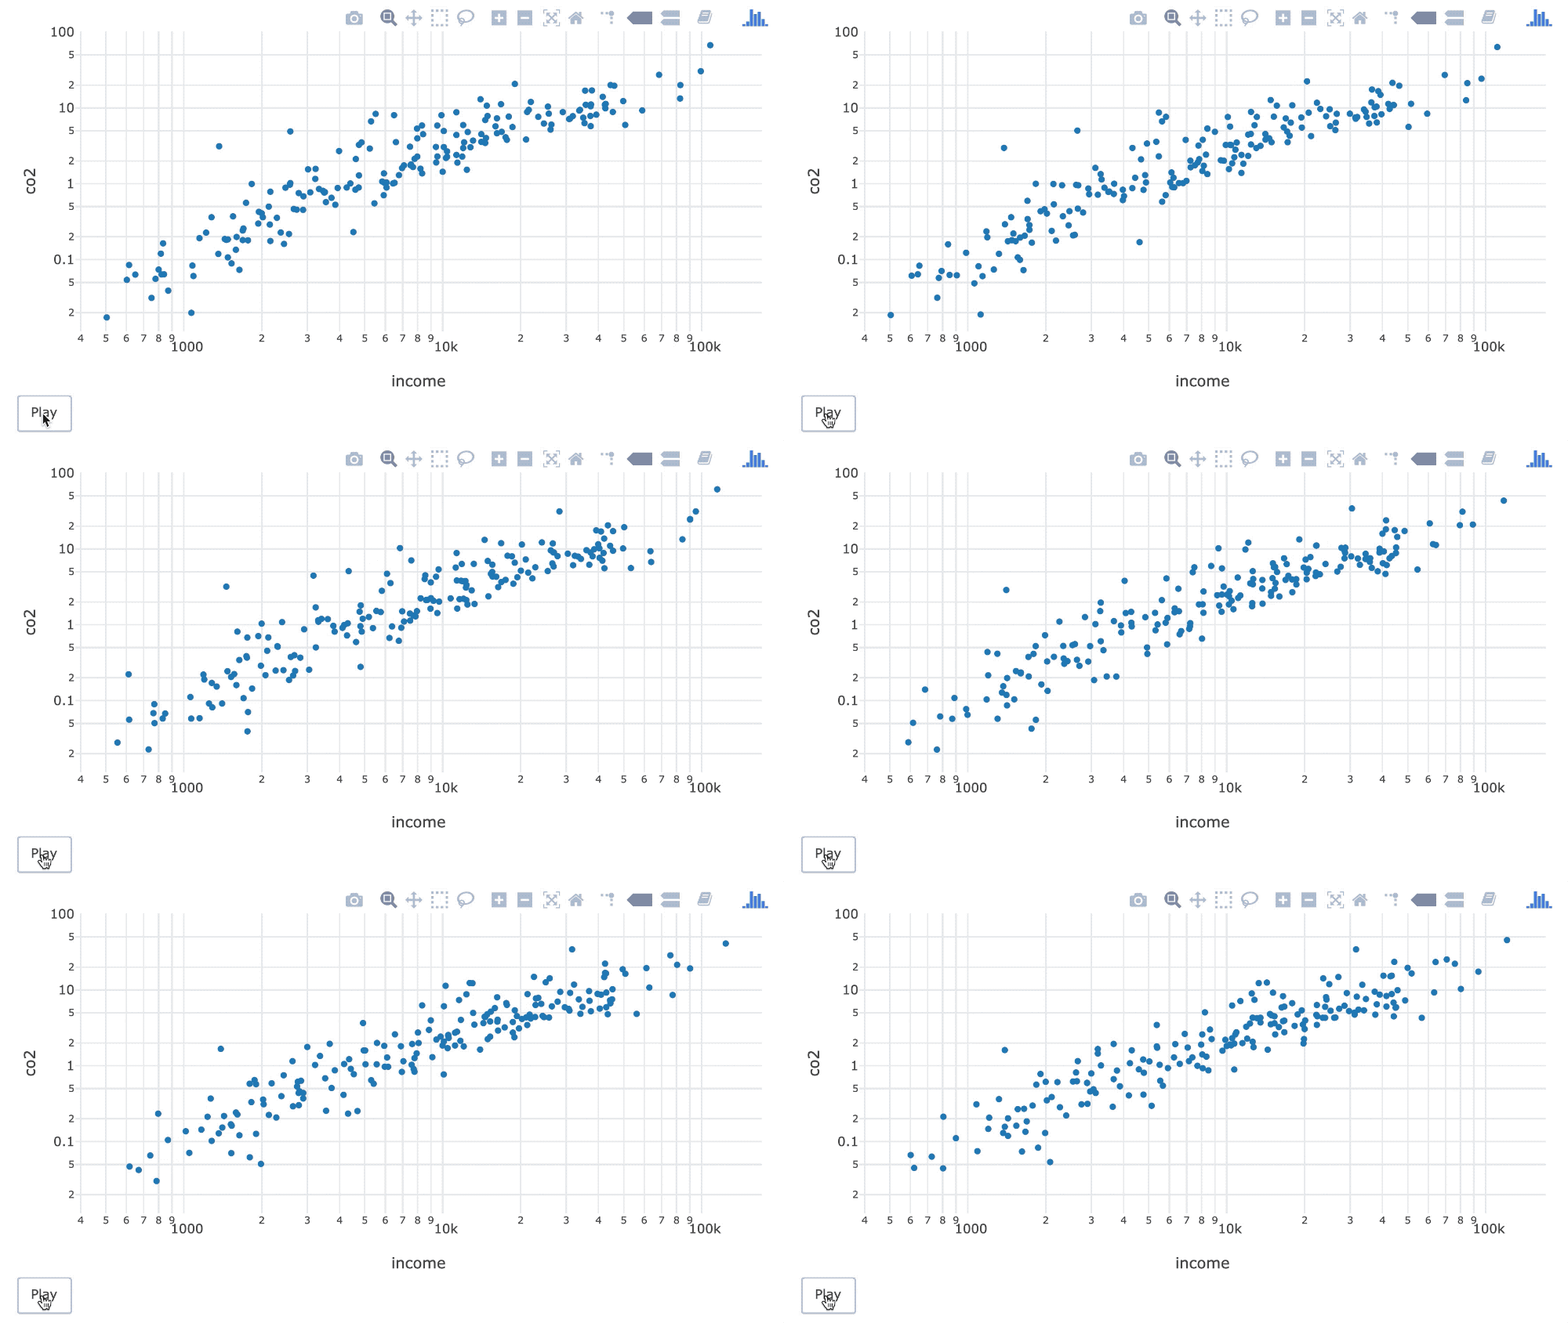
ani
ani %>%
  animation_slider(hide = TRUE)
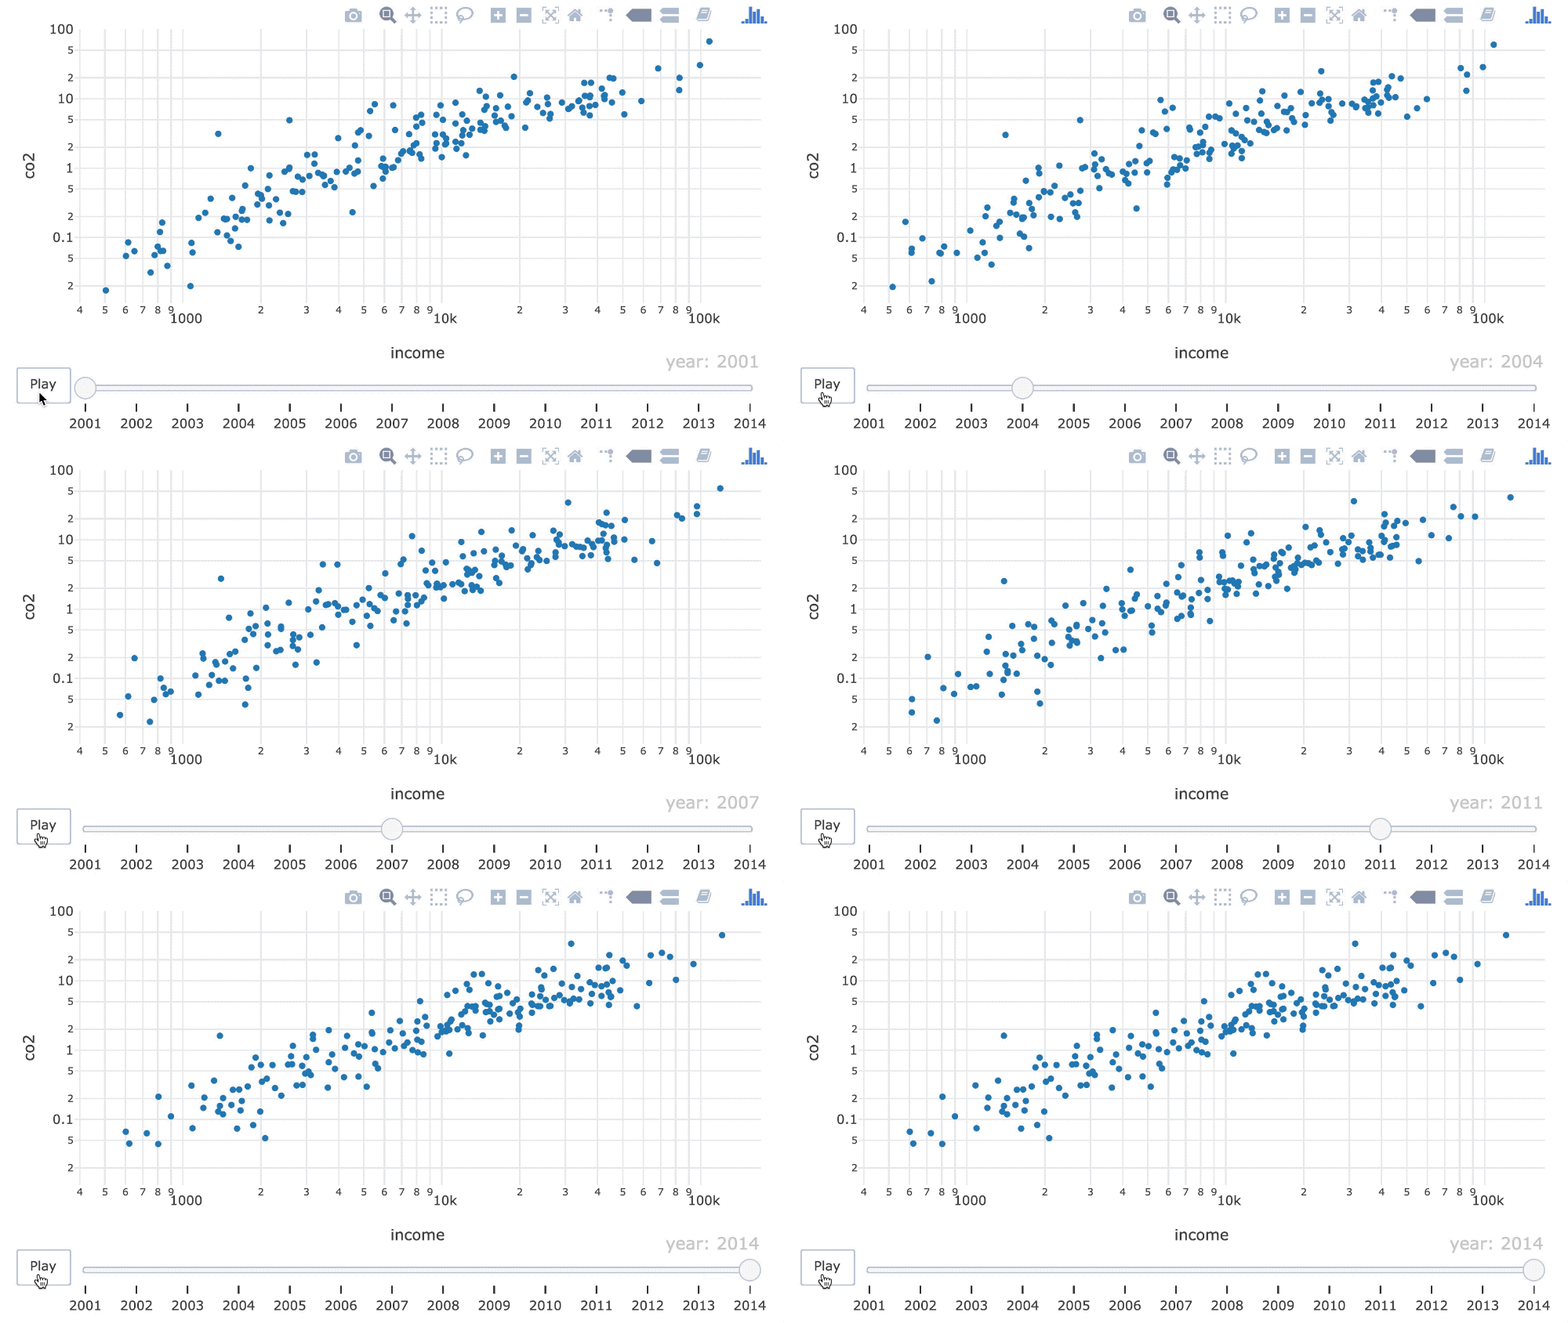
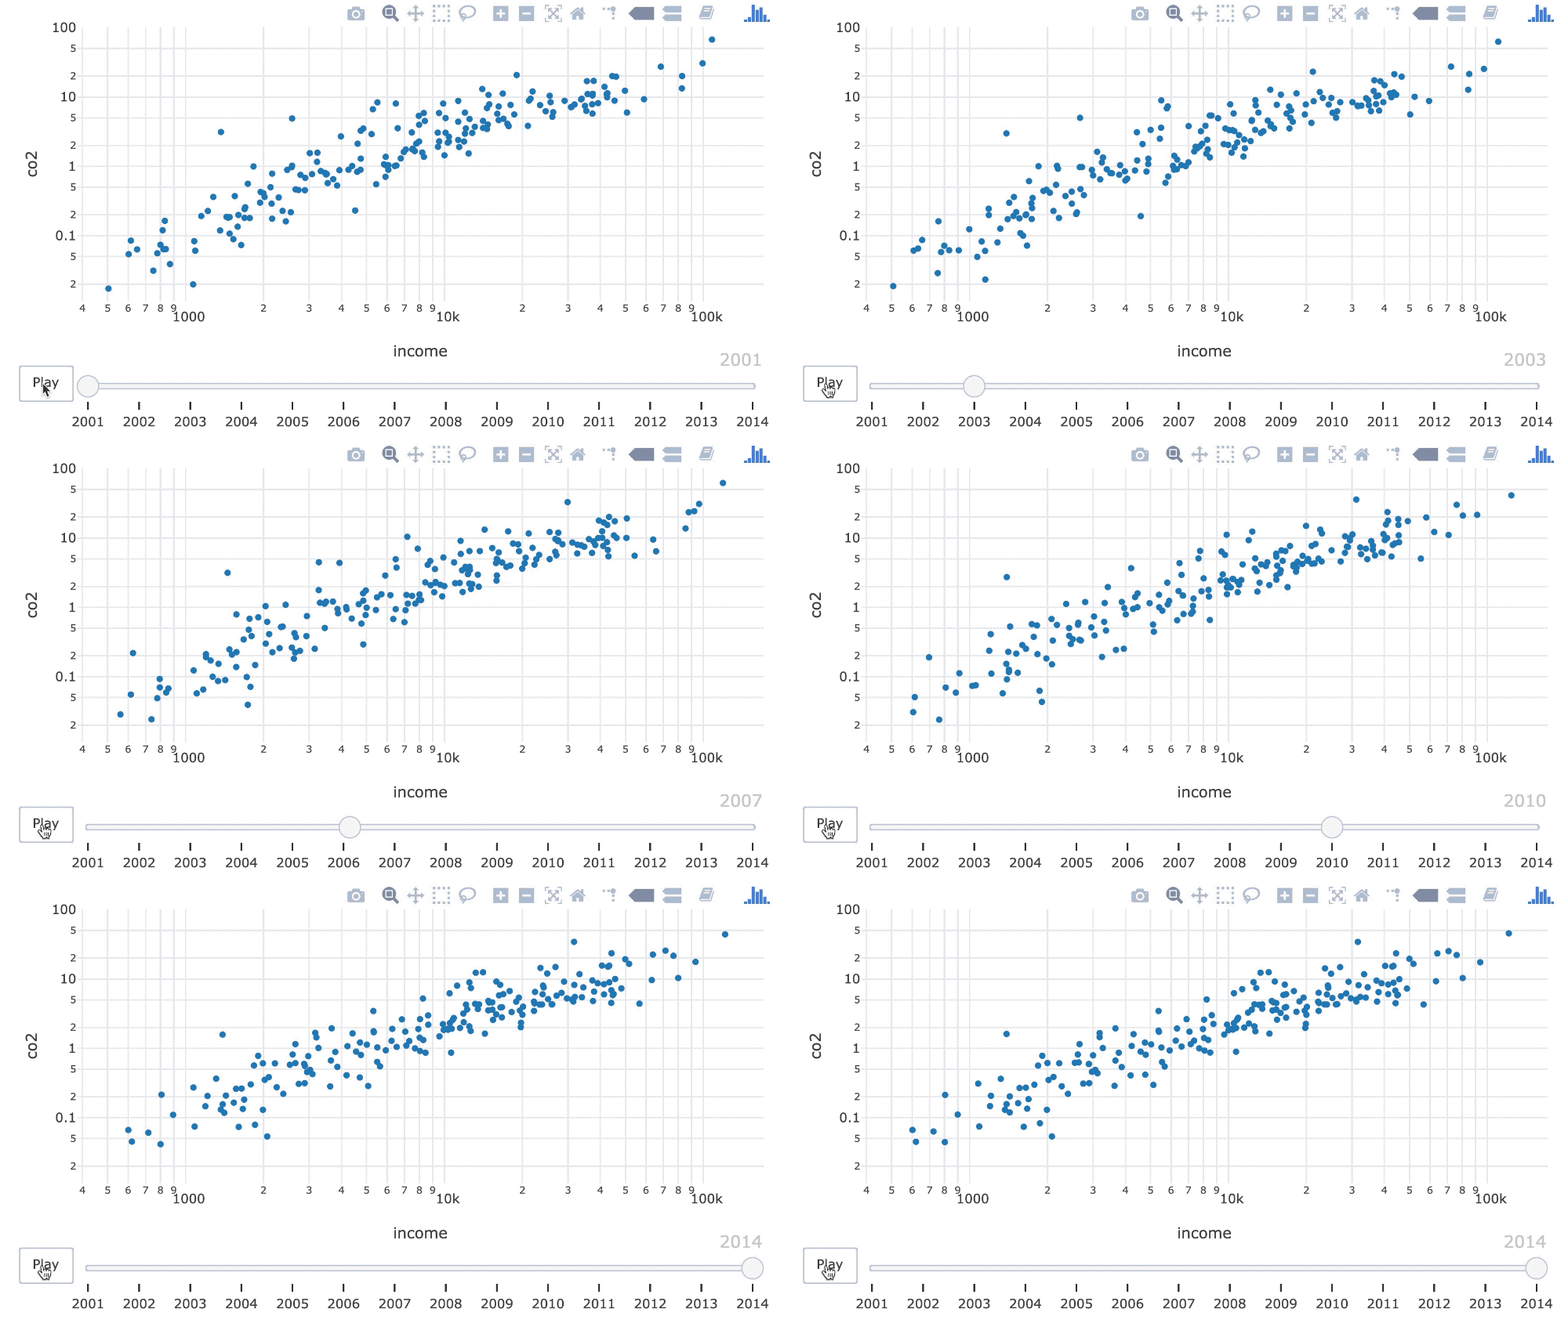
ani %>%
  animation_slider(
     currentvalue = list(prefix=NULL)
  )
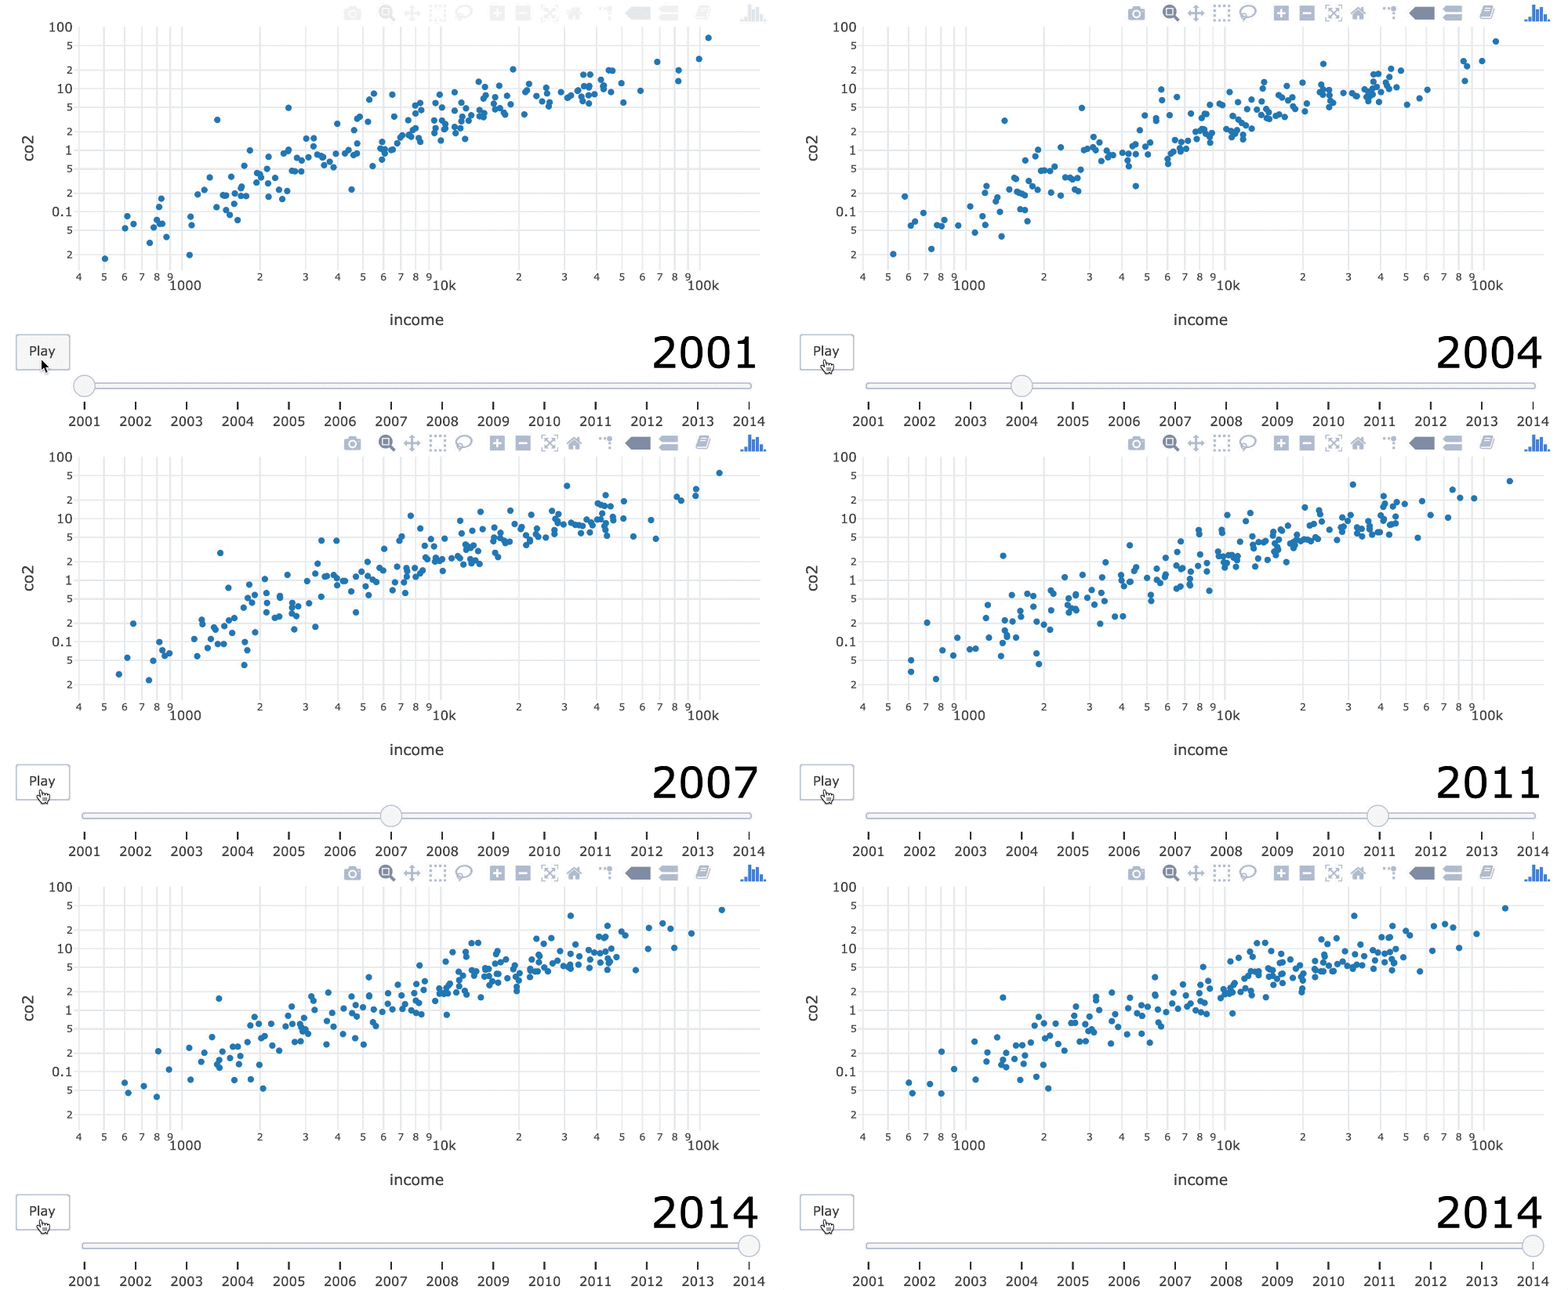
ani %>%
  animation_slider(
     currentvalue = list(prefix=NULL,
        font = list(
           color = "black",
           size = 40
        )
     )
  )