Professional Quantitative Analyst and R programmer
트레이딩 지표
TTR: 고전적 트레이딩 지표 도구상자
SMA(단순이동평균)
CTA에 인기: 200일 이동평균
지난 10개월의 가격 수준을 보여줌
SMA() 사용하기
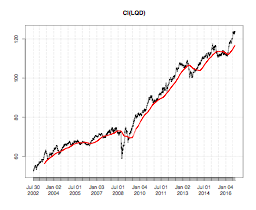
# Compute a simple moving average (SMA) across 200 days
sma <- SMA(x = Cl(LQD), n = 200)

# Add the SMA line to your plot of LQD closing price
plot(Cl(LQD))
lines(sma, col = "red")