단순 피처 지오메트리와 tidycensus

R로 분석하는 미국 인구조사 데이터

Kyle Walker

Instructor

`geometry = TRUE` 인수

  • geometry = TRUE는 다음 지역 단위에서 사용 가능합니다:
    • "state"
    • "county"
    • "tract"
    • "block group"
    • "block"
    • "zcta" (또는 "zip code tabulation area")
R로 분석하는 미국 인구조사 데이터

단순 피처 지오메트리 가져오기

library(tidycensus)
library(tidyverse)
library(sf)

cook_value <- get_acs(geography = "tract", state = "IL", 
                      county = "Cook", 
                      variables = "B25077_001", 
                      geometry = TRUE)
R로 분석하는 미국 인구조사 데이터

단순 피처 지오메트리

head(cook_value, 3)
Simple feature collection with 3 features and 5 fields
geometry type:  MULTIPOLYGON
dimension:      XY
bbox:           xmin: -87.68465 ymin: 42.01232 xmax: -87.66434 ymax: 42.02297
epsg (SRID):    4269
proj4string:    +proj=longlat +datum=NAD83 +no_defs
        GEOID                                       NAME   variable
1 17031010100    Census Tract 101, Cook County, Illinois B25077_001
2 17031010201 Census Tract 102.01, Cook County, Illinois B25077_001
3 17031010202 Census Tract 102.02, Cook County, Illinois B25077_001
  estimate   moe                       geometry
1   230700 62332 MULTIPOLYGON (((-87.6772 42...
2   151100 19099 MULTIPOLYGON (((-87.68465 4...
3   133300 84063 MULTIPOLYGON (((-87.67685 4...
R로 분석하는 미국 인구조사 데이터

tidycensus 지오메트리 시각화

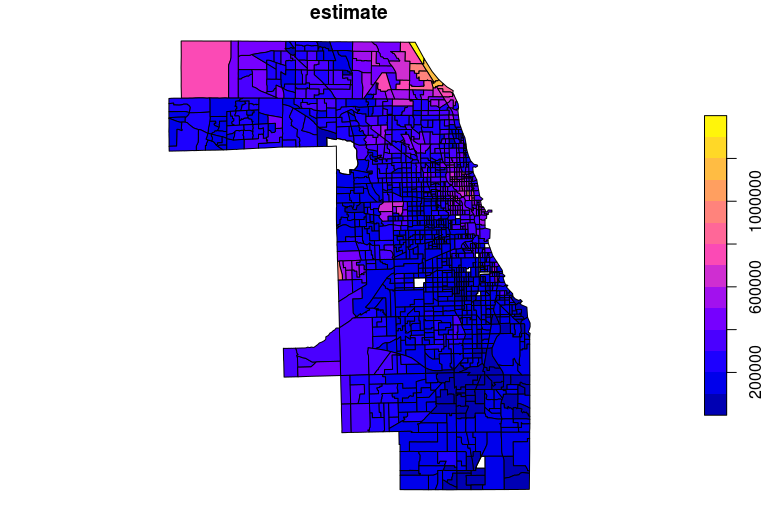
plot(cook_value["estimate"])

쿡 카운티 기본 플롯

R로 분석하는 미국 인구조사 데이터

tigris와 tidycensus 데이터 조인

library(tigris)

idaho_income <- get_acs(geography = "school district (unified)", 
                        variables = "B19013_001", 
                        state = "ID")

idaho_school <- school_districts(state = "ID", 
                                 type = "unified", 
                                 class = "sf")

id_school_joined <- left_join(idaho_school, 
                              idaho_income, 
                              by = "GEOID")
R로 분석하는 미국 인구조사 데이터

tigris와 tidycensus 데이터 조인

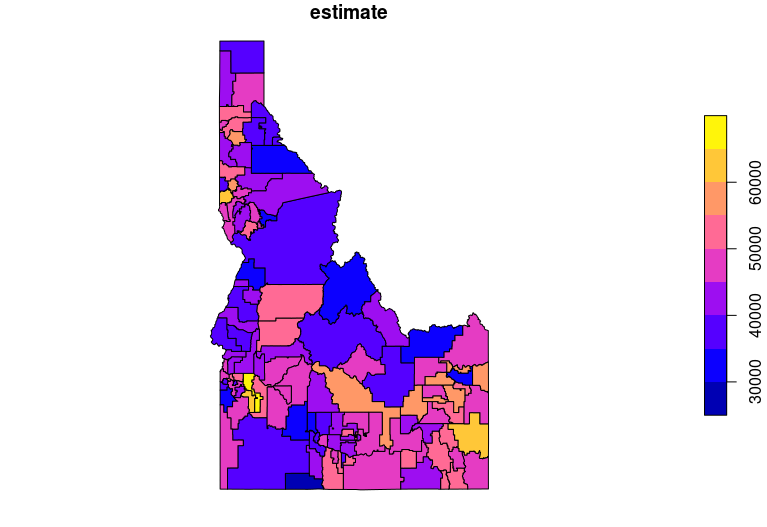
plot(id_school_joined["estimate"])

아이다호 학군별 소득

R로 분석하는 미국 인구조사 데이터

알래스카·하와이 지오메트리 이동

state_value <- get_acs(geography = "state", 
                       variables = "B25077_001", 
                       survey = "acs1", 
                       geometry = TRUE, 
                       shift_geo = TRUE)

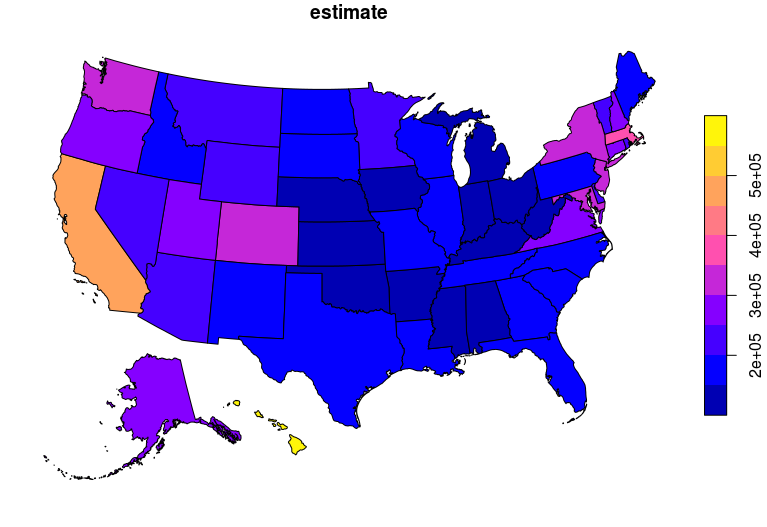
plot(state_value["estimate"])
R로 분석하는 미국 인구조사 데이터

shift_geo 플롯

R로 분석하는 미국 인구조사 데이터

연습해 봅시다!

R로 분석하는 미국 인구조사 데이터

Preparing Video For Download...