tigris와 ggplot2로 데이터 시각화

R로 분석하는 미국 인구조사 데이터

Kyle Walker

Instructor

geom_sf()로 공간 데이터 시각화

ggplot(tx_joined) + 
  geom_sf()
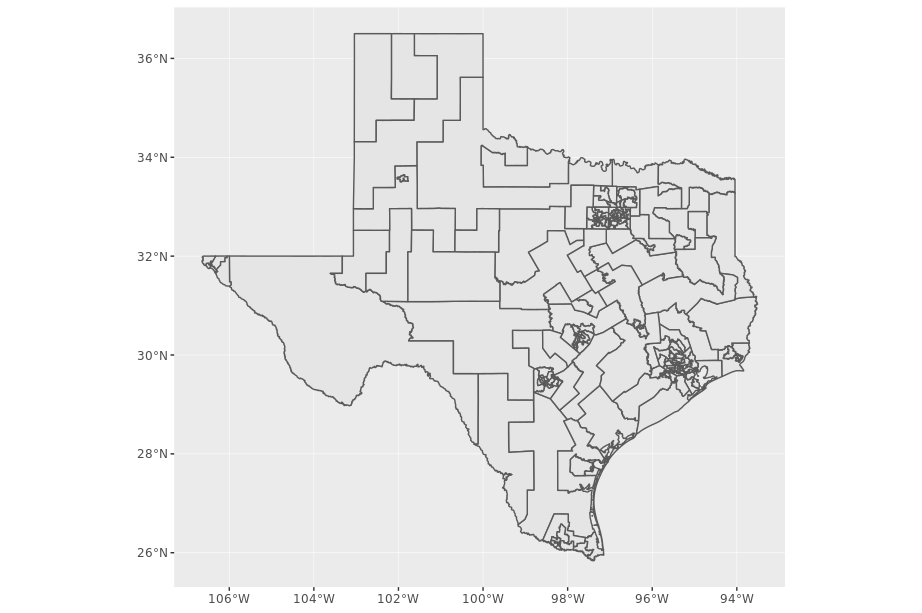
geom_sf 플롯

R로 분석하는 미국 인구조사 데이터

지역 채우기 미학 설정

ggplot(tx_joined, aes(fill = Party)) + 
  geom_sf()
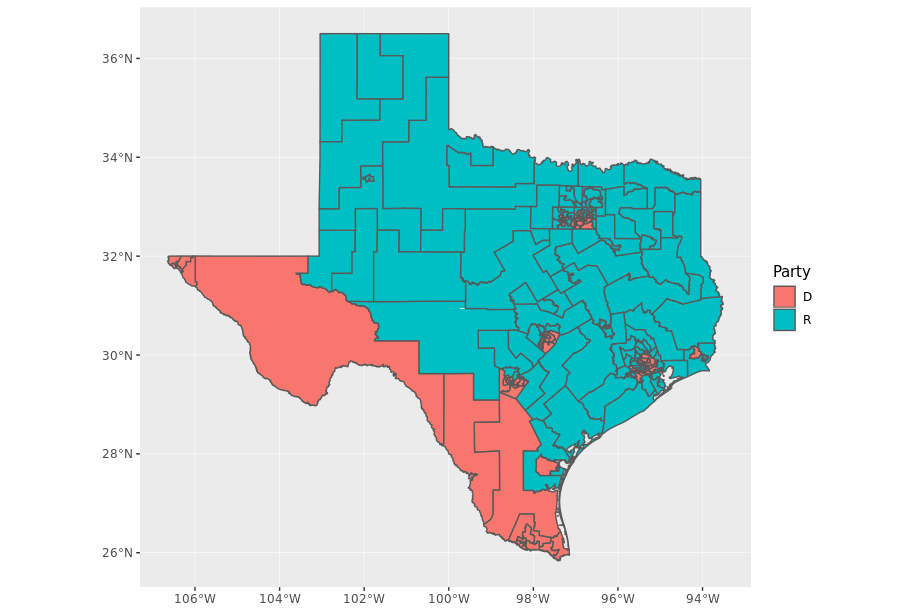
geom_sf 채우기 플롯

R로 분석하는 미국 인구조사 데이터

채우기 색상 사용자 지정

ggplot(tx_joined, aes(fill = Party)) + 
  geom_sf() + 
  scale_fill_manual(values = c("R" = "red", "D" = "blue"))
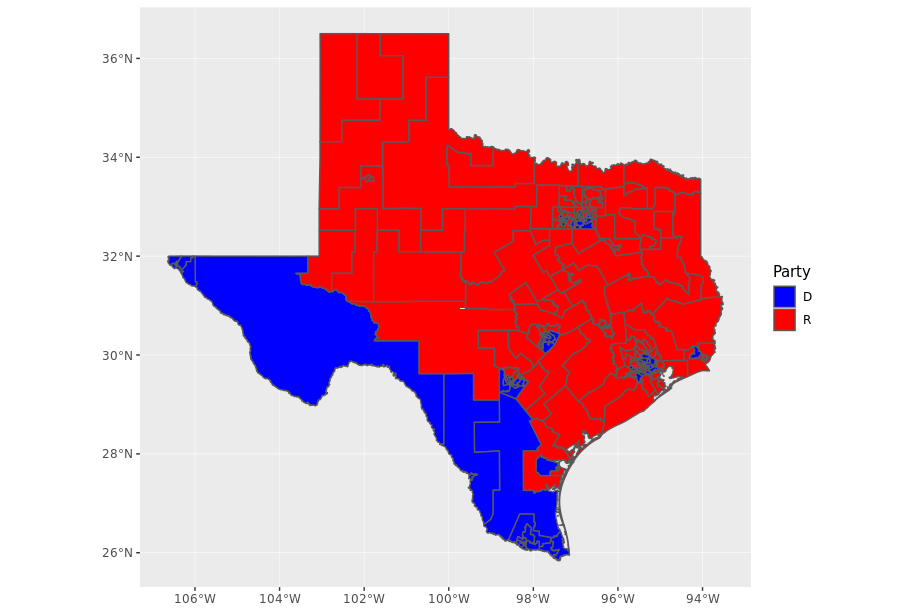
geom_sf 색상 지정 플롯

R로 분석하는 미국 인구조사 데이터

출력 다듬기

ggplot(tx_joined, aes(fill = Party)) + 
  geom_sf() + 
  coord_sf(crs = 3083, datum = NA) + 
  scale_fill_manual(values = c("R" = "red", "D" = "blue")) + 
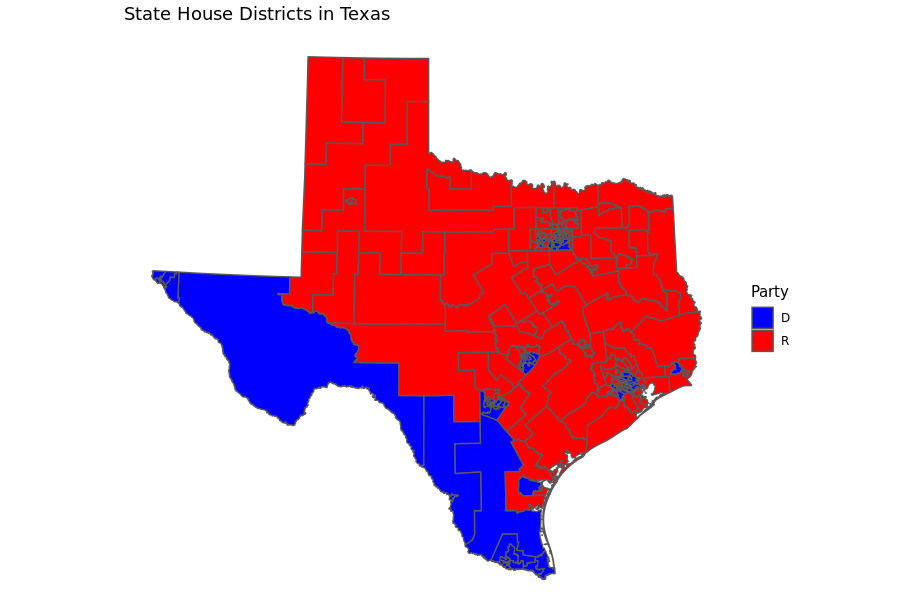
  theme_minimal() + 
  labs(title = "State House Districts in Texas")
R로 분석하는 미국 인구조사 데이터

완성된 공간 플롯

R로 분석하는 미국 인구조사 데이터

연습해 봅시다!

R로 분석하는 미국 인구조사 데이터

Preparing Video For Download...