ACS의 오차 한계 시각화

R로 분석하는 미국 인구조사 데이터

Kyle Walker

Instructor

불확실성 시각화

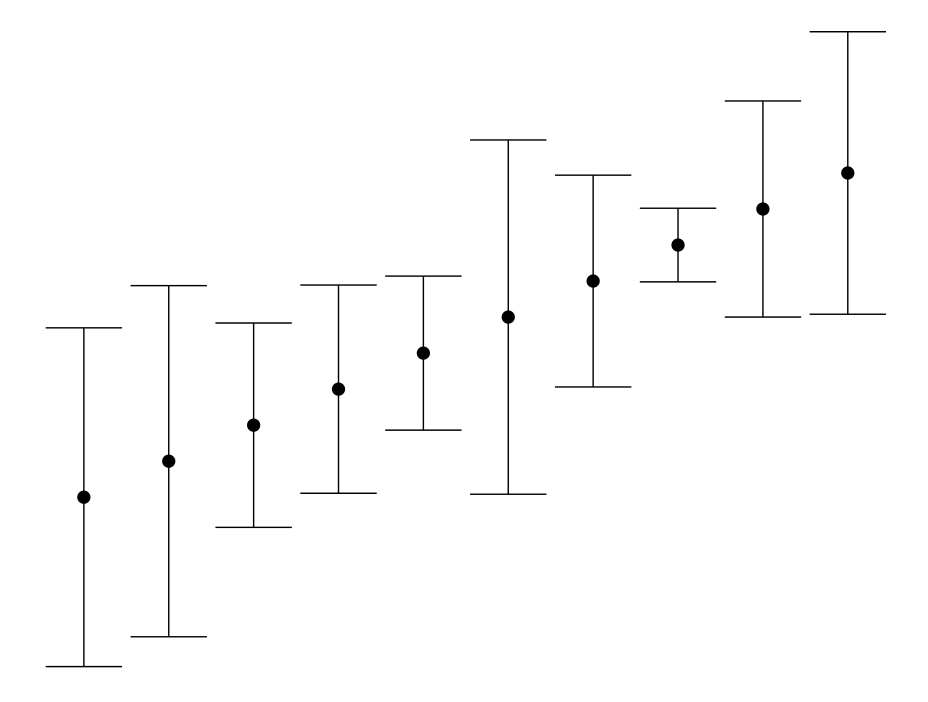
  • 일반적인 방법: 오차 막대 그래프

오차 막대 그래프 예시

R로 분석하는 미국 인구조사 데이터

ggplot2에서 오차 한계 그래프

  • ggplot2에서: geom_errorbar() 및 geom_errorbarh()
library(tidycensus)
library(tidyverse)

wyoming_age <- get_acs(geography = "county", 
                       variables = c(medianage = "B01002_001"), 
                       state = "WY")  

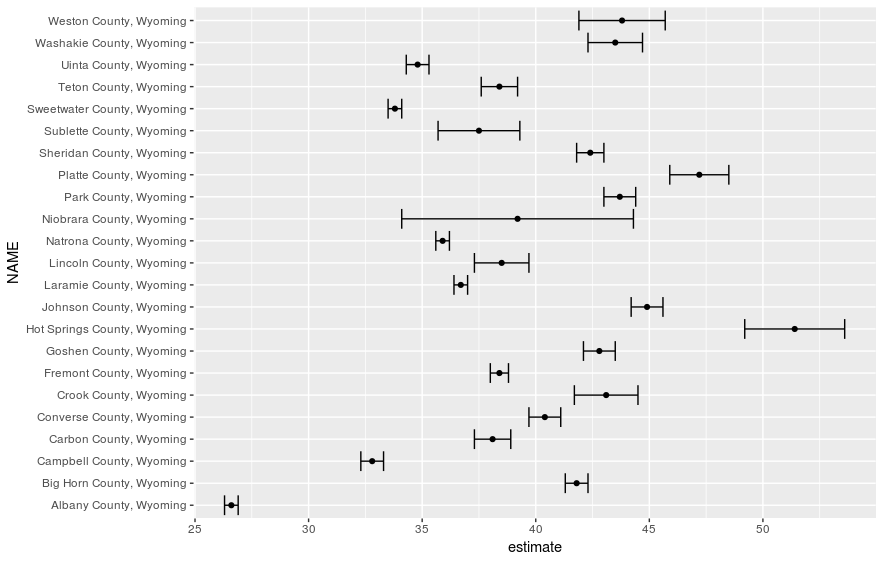
ggplot(wyoming_age, aes(x = estimate, y = NAME)) + 
  geom_errorbarh(aes(xmin = estimate - moe, 
                     xmax = estimate + moe)) + 
  geom_point()
R로 분석하는 미국 인구조사 데이터

서식 미적용 오차 한계 그래프

R로 분석하는 미국 인구조사 데이터

오차 한계 그래프 서식 지정

wyoming_age2 <- wyoming_age %>%
  mutate(NAME = str_replace(NAME, " County, Wyoming", ""))

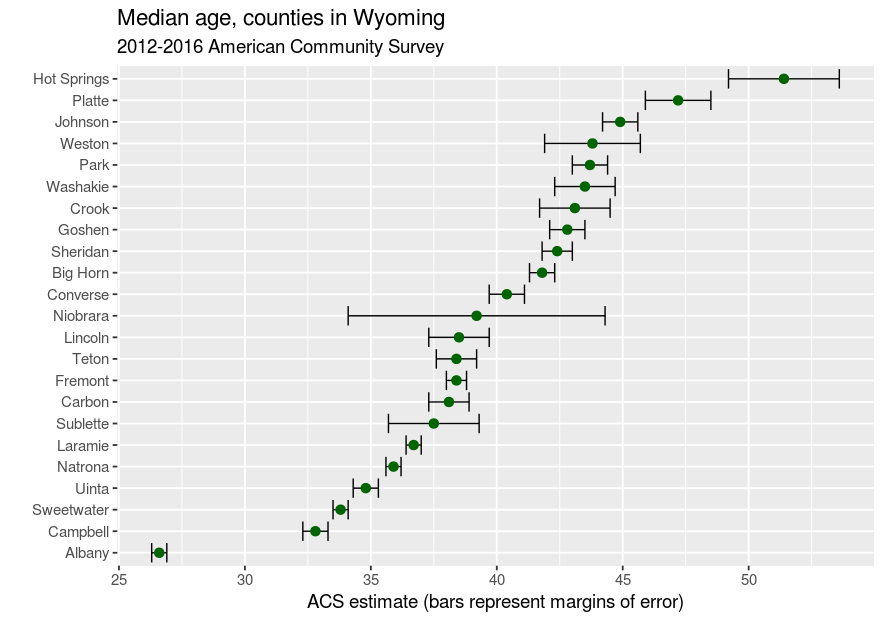
ggplot(wyoming_age2, aes(x = estimate, y = reorder(NAME, estimate))) + geom_errorbarh(aes(xmin = estimate - moe, xmax = estimate + moe)) + geom_point(size = 3, color = "darkgreen") + theme_grey(base_size = 14) + labs(title = "Median age, counties in Wyoming", subtitle = "2012-2016 American Community Survey", x = "ACS estimate (bars represent margins of error)", y = "")
R로 분석하는 미국 인구조사 데이터

서식 적용 오차 한계 그래프

R로 분석하는 미국 인구조사 데이터

연습해 봅시다!

R로 분석하는 미국 인구조사 데이터

Preparing Video For Download...