R로 배우는 Market Basket Analysis
Christopher Bruffaerts
Statistician
가게엔 무엇이 있나?

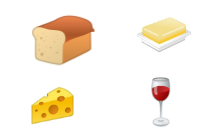
바스켓 1: {"Bread", "Cheese"}
바스켓 2: {"Bread", "Wine" , "Cheese"}
여러 바스켓
고객 100명이 마트에 온다면, 함께 사는 아이템의 연관을 찾을 수 있을까?
예시: Bread와 Cheese

결과: “if this, then that”
여러 바스켓에서 학습하기

다양한 적용 분야
여러 바스켓이 있는 데이터셋을 만듭니다!
my_baskets = data.frame(
"Basket" = c(1,1,1,1, 2,2,2, 3,3, 4,4,4, 5,5, 6,6, 7,7),
"Product" = c("Bread", "Cheese", "Cheese", "Cheese",
"Bread", "Butter", "Wine",
"Butter", "Butter",
"Butter", "Wine", "Wine",
"Butter", "Cheese",
"Cheese", "Wine",
"Wine", "Wine")
)
내 바스켓 미리보기
head(my_baskets)
Basket Product
1 1 Bread
2 1 Cheese
3 1 Cheese
4 1 Cheese
5 2 Bread
6 2 Butter
질문
n_distinct(my_baskets$Product)
[1] 4
n_distinct(my_baskets$Basket)
[1] 7
df_basket =
my_baskets %>%
group_by(Basket) %>%
summarize(
n_total = n(),
n_items = n_distinct(Product))
Basket n_total n_items
<dbl> <int> <int>
1 1 4 2
2 2 3 3
평균 바스켓 크기
basket_size %>%
summarize(
avg_total_items = mean(n_total),
avg_dist_items = mean(n_items))
# A tibble: 1 x 2
avg_total_items avg_dist_items
<dbl> <dbl>
1 2.57 1.86
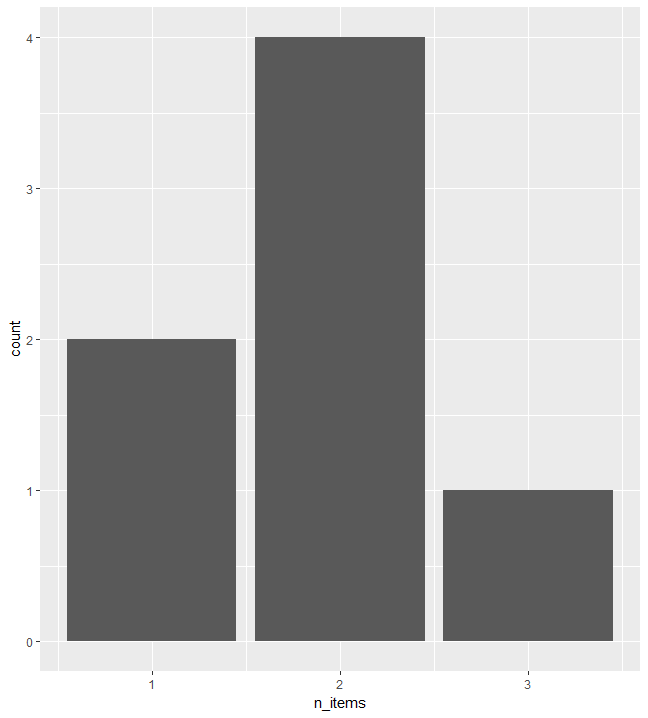
바스켓 크기 분포
# 고유 상품 분포
ggplot(df_basket, aes(n_items)) +
geom_bar()
어떤 상품을 볼까?
모든 바스켓에서 해당 상품의 총 등장 횟수
그 상품을 포함한 바스켓 수
예시:

R에서 Cheese 필터링
# Cheese를 포함한 바스켓 수
my_baskets %>%
filter(Product == "Cheese") %>%
summarize(
n_tot_items = n(),
n_basket_item = n_distinct(Basket))
n_tot_items n_basket_item
1 5 3
연관 규칙 마이닝: 아이템 집합에서 자주 함께 나타나는 연관을 찾기.
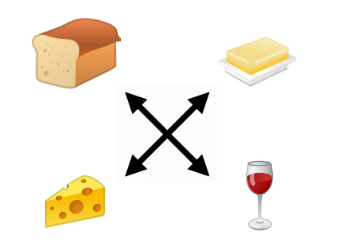
규칙 추출 예:
남은 과정의 아젠다:

R로 배우는 Market Basket Analysis