규칙에서 그래프 시각화로

R로 배우는 Market Basket Analysis

Christopher Bruffaerts

Statistician

규칙 시각화
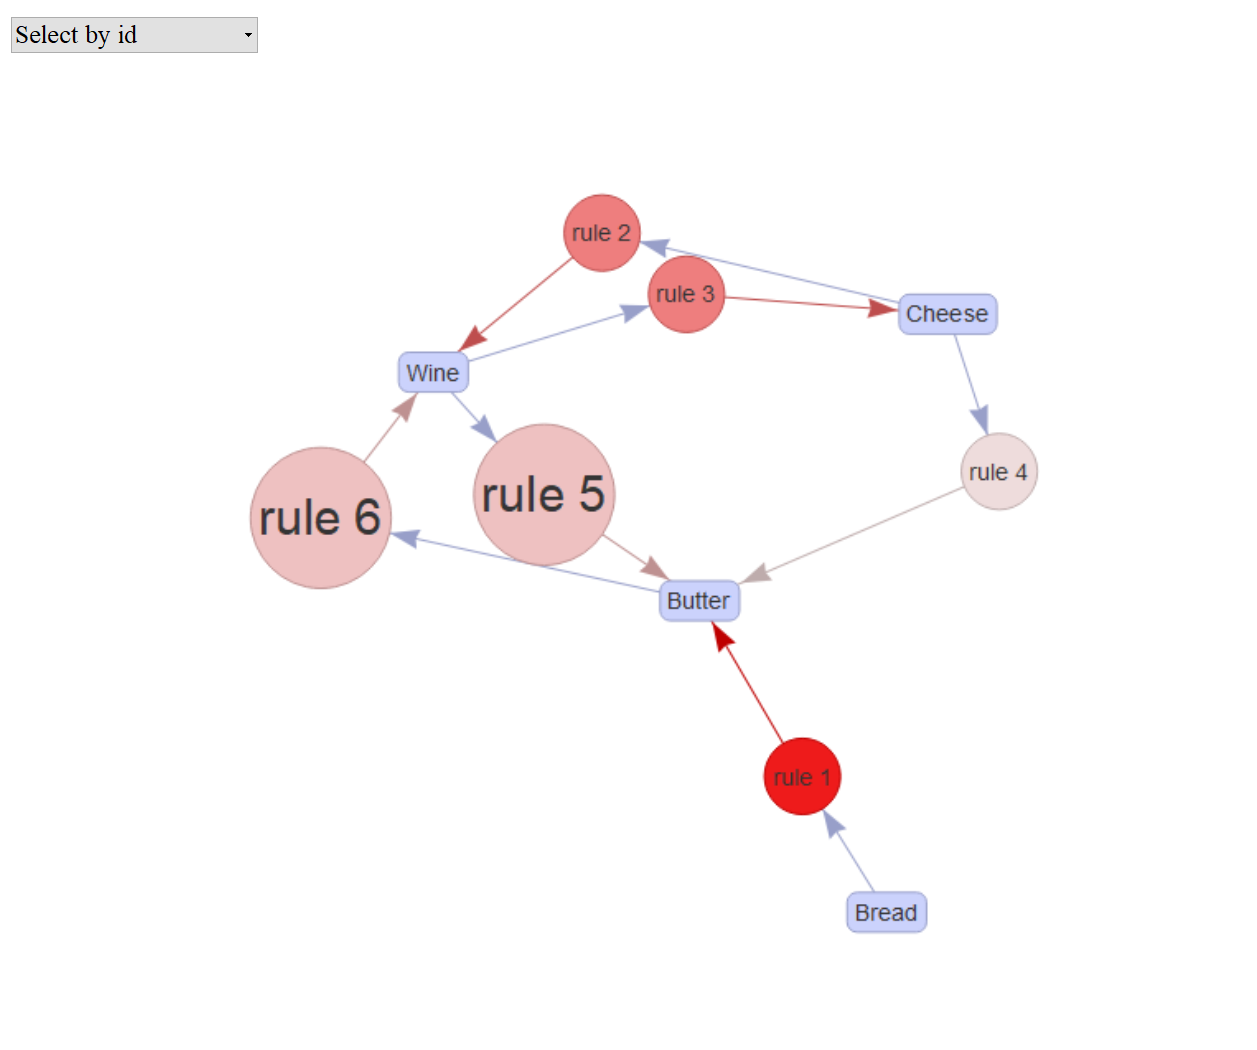
인터랙티브 규칙

rules_html = plot(rules, method = "graph",
                  engine = "htmlwidget")
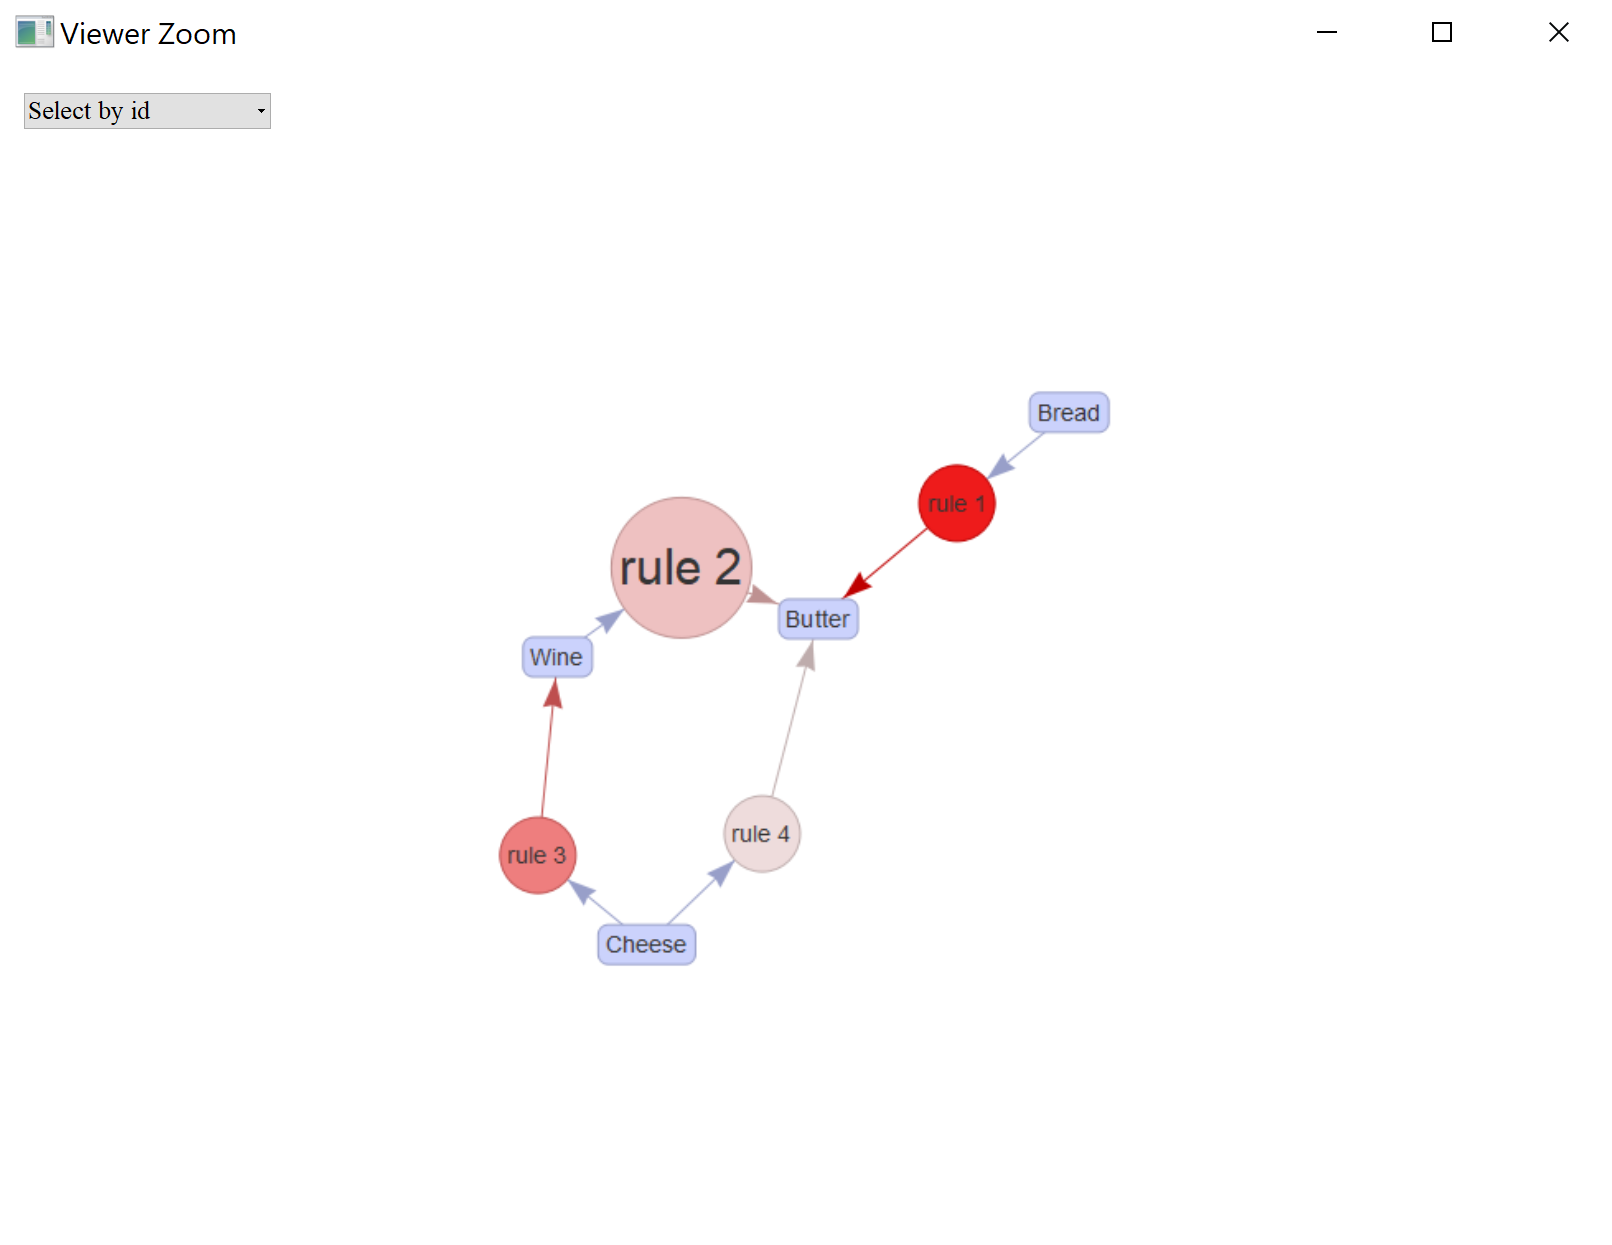
rules_html

HTML 위젯 저장

library(htmlwidgets)
saveWidget(rules_html, file = "rules_grocery.html")

규칙 그래프

R로 배우는 Market Basket Analysis

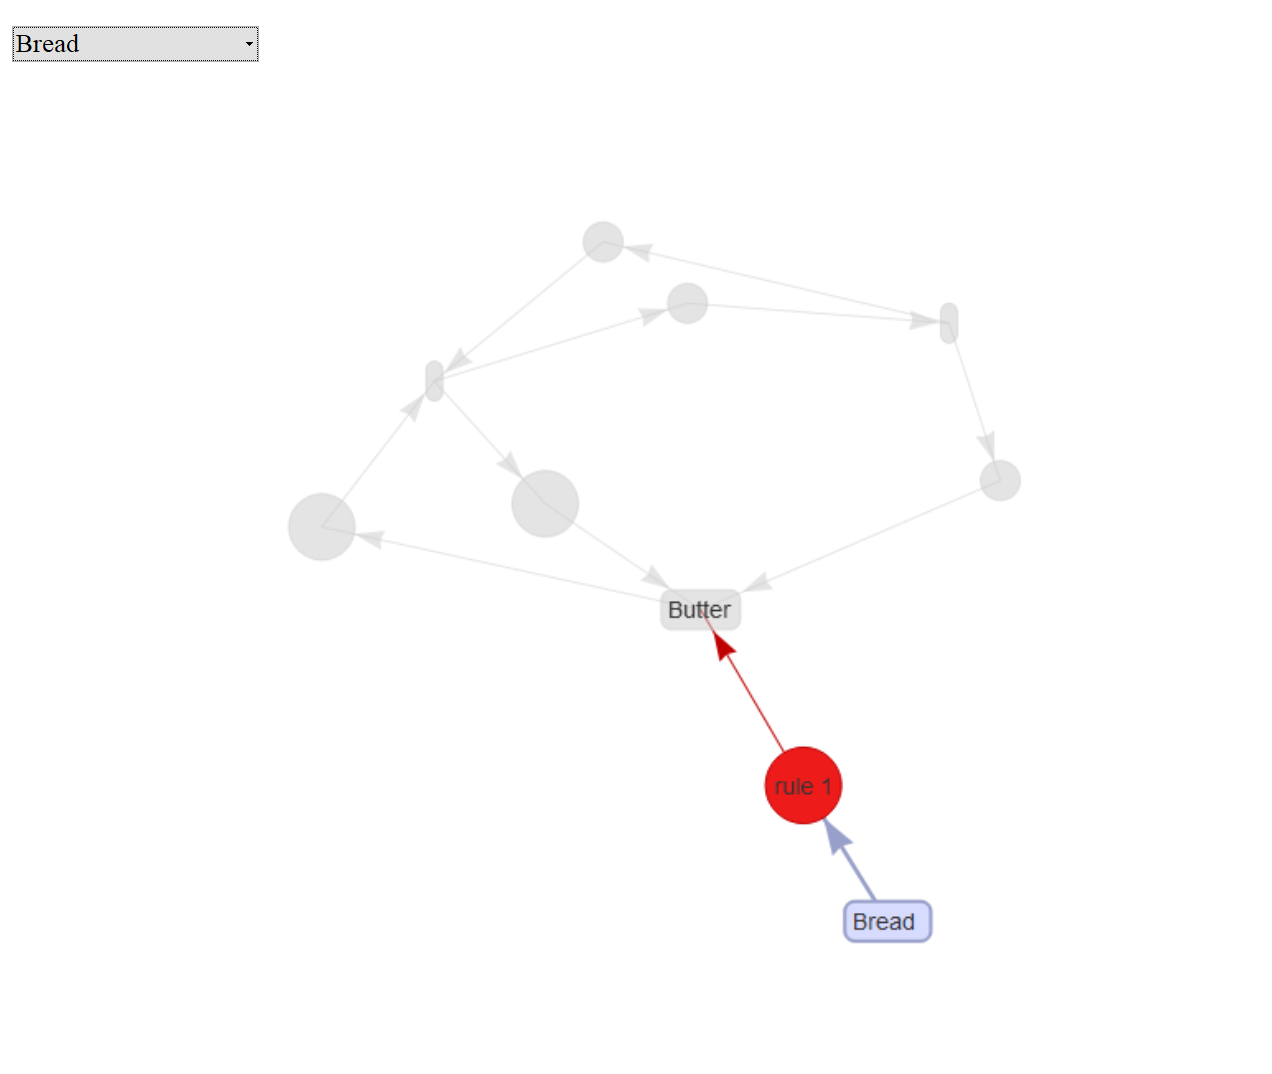
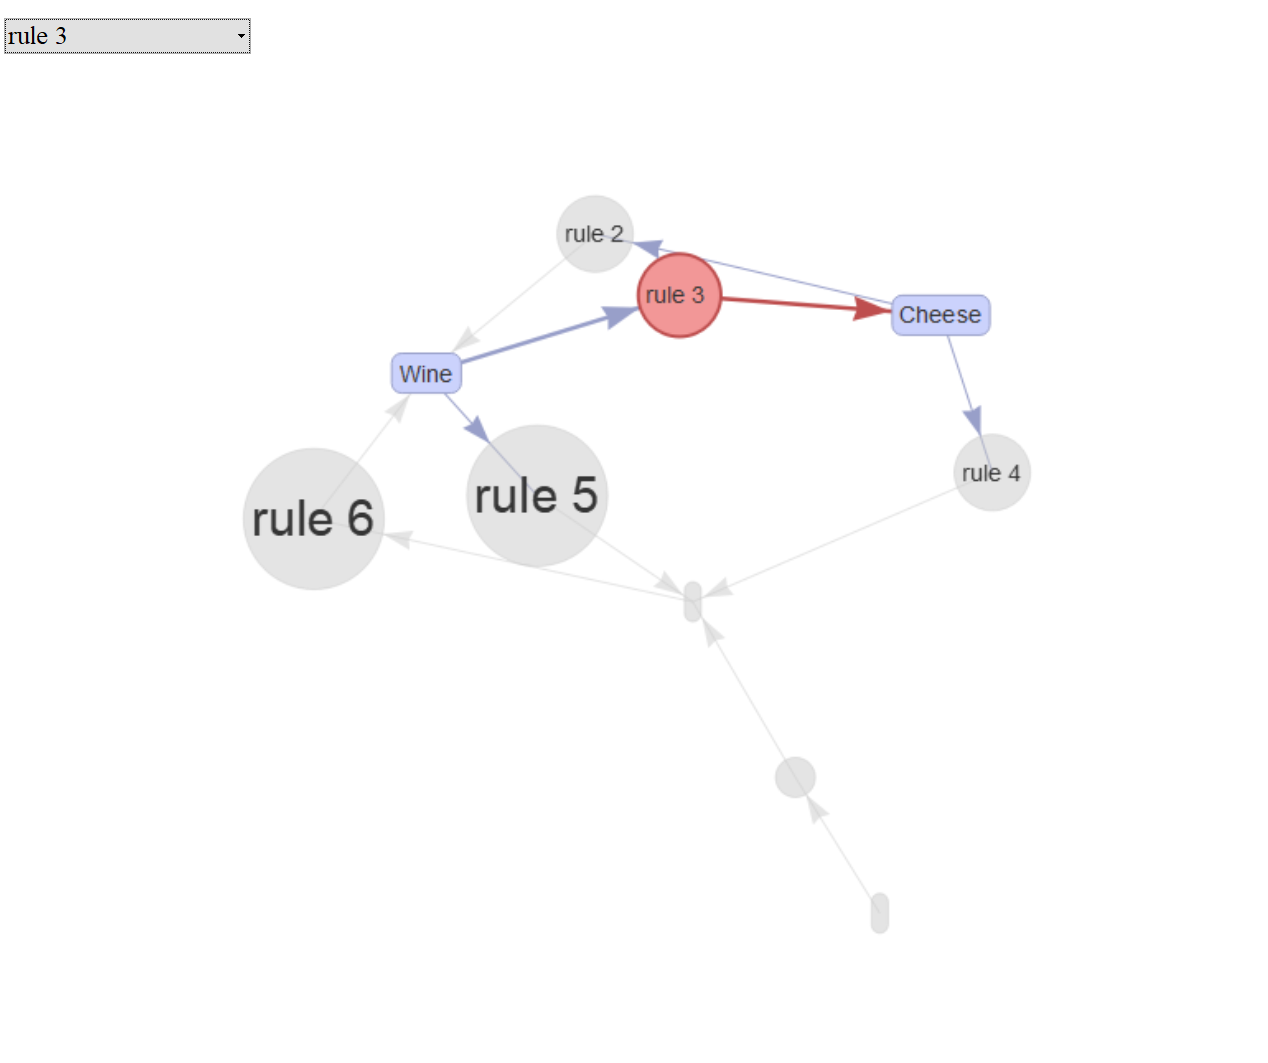
그래프에서 품목과 규칙 선택

품목 Bread 선택

그래프 규칙_Bread

규칙 3 선택

그래프 규칙3

R로 배우는 Market Basket Analysis

그래프와 서브그래프 (1)

신뢰도로 규칙 정렬

top4subRules = 
    head(sort(rules, by = "confidence"), 4)
inspect(top4subRules)
    lhs         rhs      support   confidence lift      count
[1] {Bread}  => {Butter} 0.4285714 1.00       1.1666667 3    
[2] {Wine}   => {Butter} 0.5714286 0.80       0.9333333 4    
[3] {Cheese} => {Wine}   0.4285714 0.75       1.0500000 3    
[4] {Cheese} => {Butter} 0.4285714 0.75       0.8750000 3

고신뢰도 규칙 그래프 그리기

plot(top4subRules, method = "graph",  engine = "htmlwidget")
신뢰도 높은 규칙 그래프

R로 배우는 Market Basket Analysis

그래프와 서브그래프 (2)

치즈 관련 규칙 확인

C_rules = 
    apriori(data = data_trx, 
            parameter = list(supp = 3/7,
                             conf = 0.2,
                             minlen = 2),
            appearance = list(rhs = "Cheese"))
inspect(C_rules)
    lhs         rhs      support   confidence lift  count
[1] {Wine}   => {Cheese} 0.4285714 0.6        1.050 3    
[2] {Butter} => {Cheese} 0.4285714 0.5        0.875 3

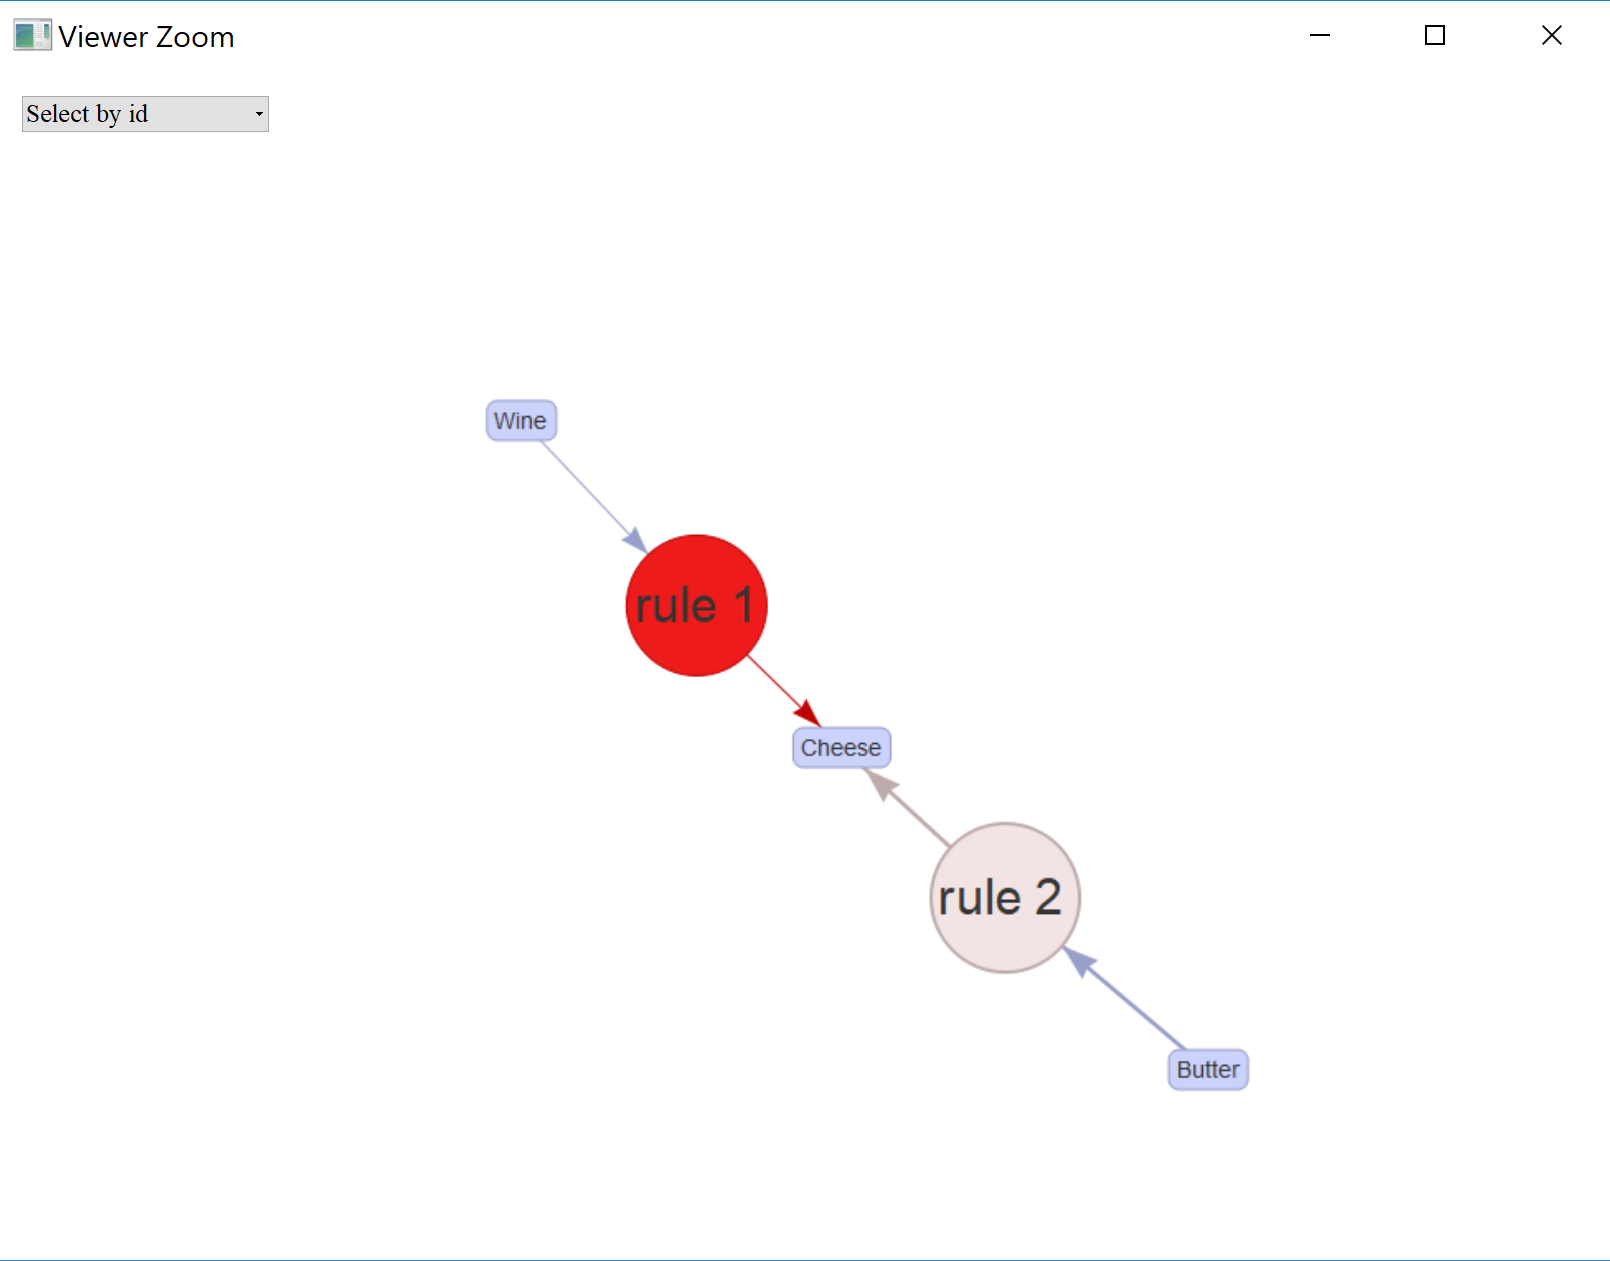
치즈 규칙 그래프 그리기

plot(C_rules, method = "graph",  engine = "htmlwidget")

치즈 규칙 그래프

R로 배우는 Market Basket Analysis

Graph로 저장

그래프 저장하기

saveAsGraph(rules, file = "rules.graphml")
R로 배우는 Market Basket Analysis

규칙을 만들어 봅시다!

R로 배우는 Market Basket Analysis

Preparing Video For Download...