R로 배우는 Market Basket Analysis
Christopher Bruffaerts
Statistician
항목 빈도 플롯
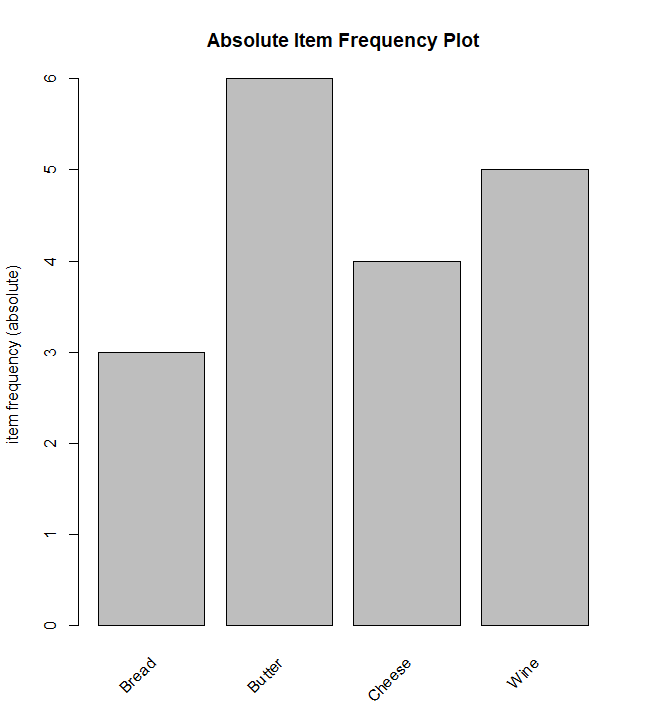
절대값 유형
itemFrequencyPlot(data_trx,
                  main='Absolute Item Frequency Plot',
                  type="absolute"
)
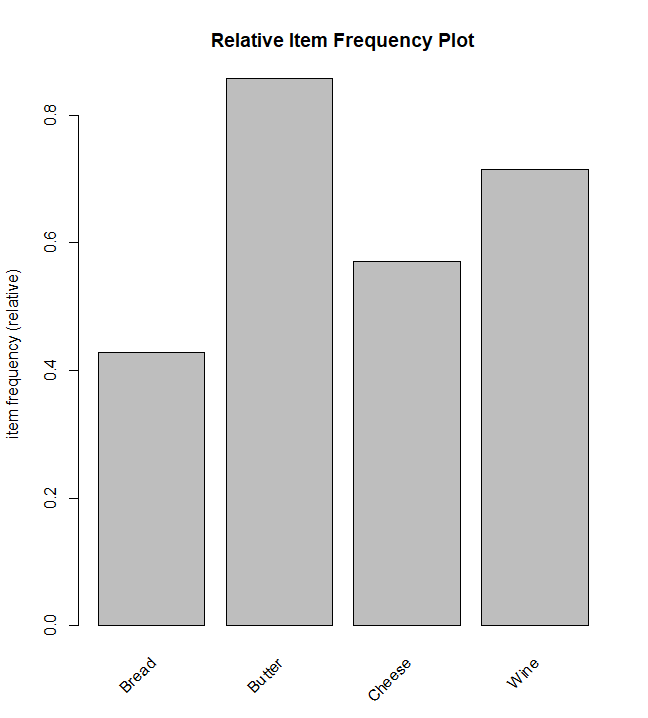
상대값 유형
itemFrequencyPlot(data_trx,
                  main='Relative Item Frequency Plot',
                  type="relative"
)
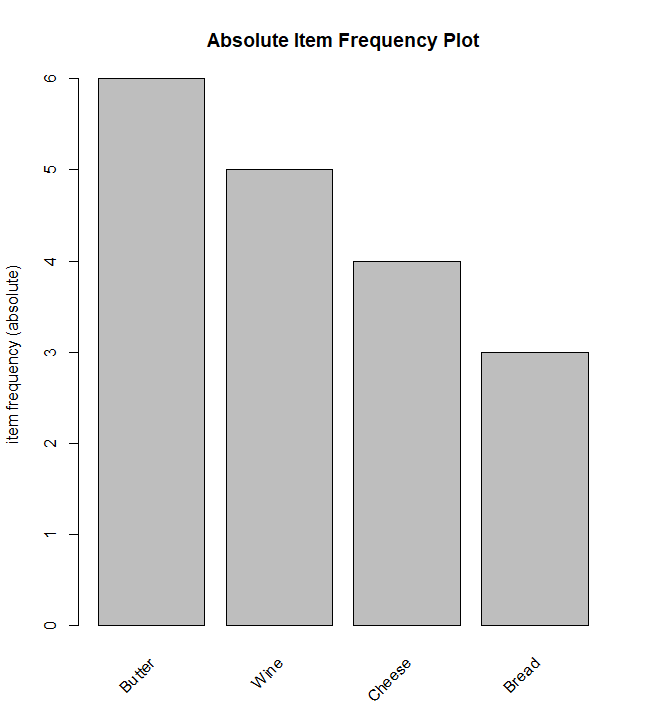
topN으로 재정렬 및 필터링
itemFrequencyPlot(
  data_trx,
  topN = 4,
  main = 'Absolute Item Frequency Plot',
  type = "absolute"
)
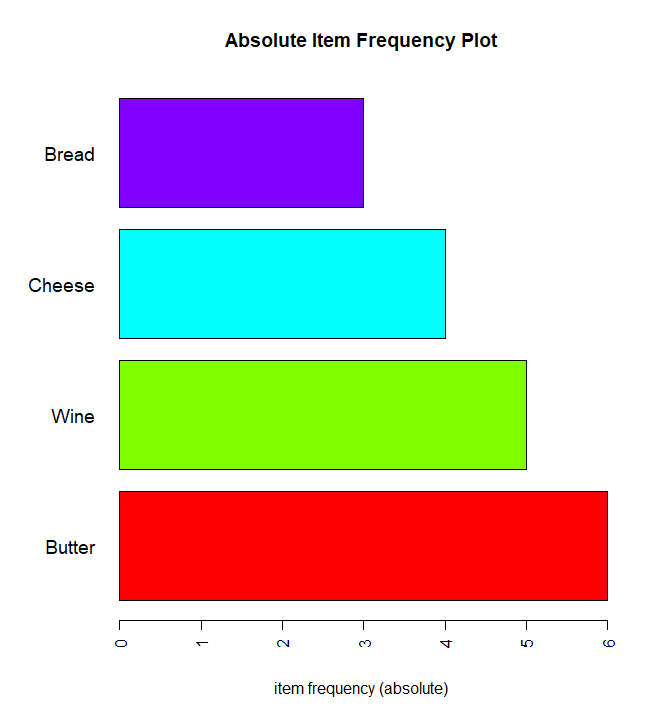
플립 및 사용자 지정
itemFrequencyPlot(
  data_trx,
  topN = 4,
  main = 'Absolute Item Frequency Plot',
  type = "absolute",
  col = rainbow(4),
  ylab = "",
  cex.names = 1.2,
  horiz = TRUE
)