적절한 주성분 수 선택

R로 배우는 Machine Learning 기반 마케팅 분석

Verena Pflieger

Data Scientist at INWT Statistics

관련 성분 수: 설명된 분산

# Proportion of variance explained:
summary(pcaCust)
Importance of components:
                          PC1    PC2    PC3     PC4     PC5     PC6     PC7
Standard deviation     2.0951 1.8379 1.2960 1.20415 1.12301 1.07453 0.80486
Proportion of Variance 0.2743 0.2111 0.1050 0.09062 0.07882 0.07216 0.04049
Cumulative Proportion  0.2743 0.4855 0.5904 0.68106 0.75989 0.83205 0.87254
                           PC8     PC9    PC10    PC11    PC12    PC13
Standard deviation     0.78236 0.72452 0.61302 0.48428 0.36803 0.25901
Proportion of Variance 0.03826 0.03281 0.02349 0.01466 0.00847 0.00419
Cumulative Proportion  0.91079 0.94360 0.96709 0.98175 0.99021 0.99440
                          PC14    PC15    PC16
Standard deviation     0.20699 0.17126 0.13170
Proportion of Variance 0.00268 0.00183 0.00108
Cumulative Proportion  0.99708 0.99892 1.00000
R로 배우는 Machine Learning 기반 마케팅 분석

관련 성분 수: Kaiser-Guttman 기준

Kaiser-Guttman 기준: 고유값 > 1

pcaCust$sdev ^ 2
 [1] 4.38961593 3.37778445 1.67965616 1.44997580 1.26115351 1.15461579
 [7] 0.64780486 0.61209376 0.52492468 0.37579685 0.23452736 0.13544710
[13] 0.06708362 0.04284504 0.02933027 0.01734481
R로 배우는 Machine Learning 기반 마케팅 분석

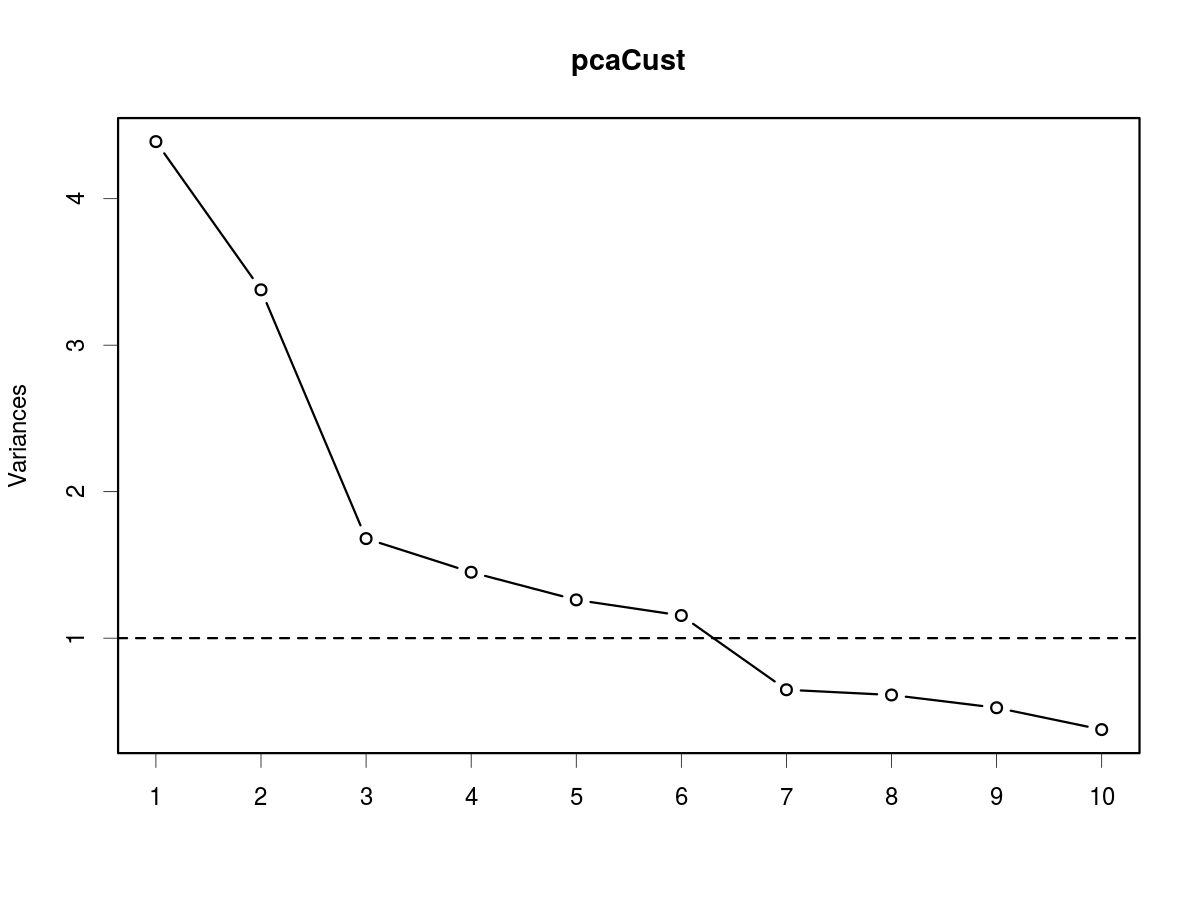
관련 성분 수: 스크리플롯

스크리플롯: "꺾이는 지점 찾기"

screeplot(pcaCust, type = "lines")
box()
abline(h = 1, lty = 2)
R로 배우는 Machine Learning 기반 마케팅 분석

기준별 제안 성분 수

설명된 분산 Kaiser-Guttman 스크리플롯
5 6 6
R로 배우는 Machine Learning 기반 마케팅 분석

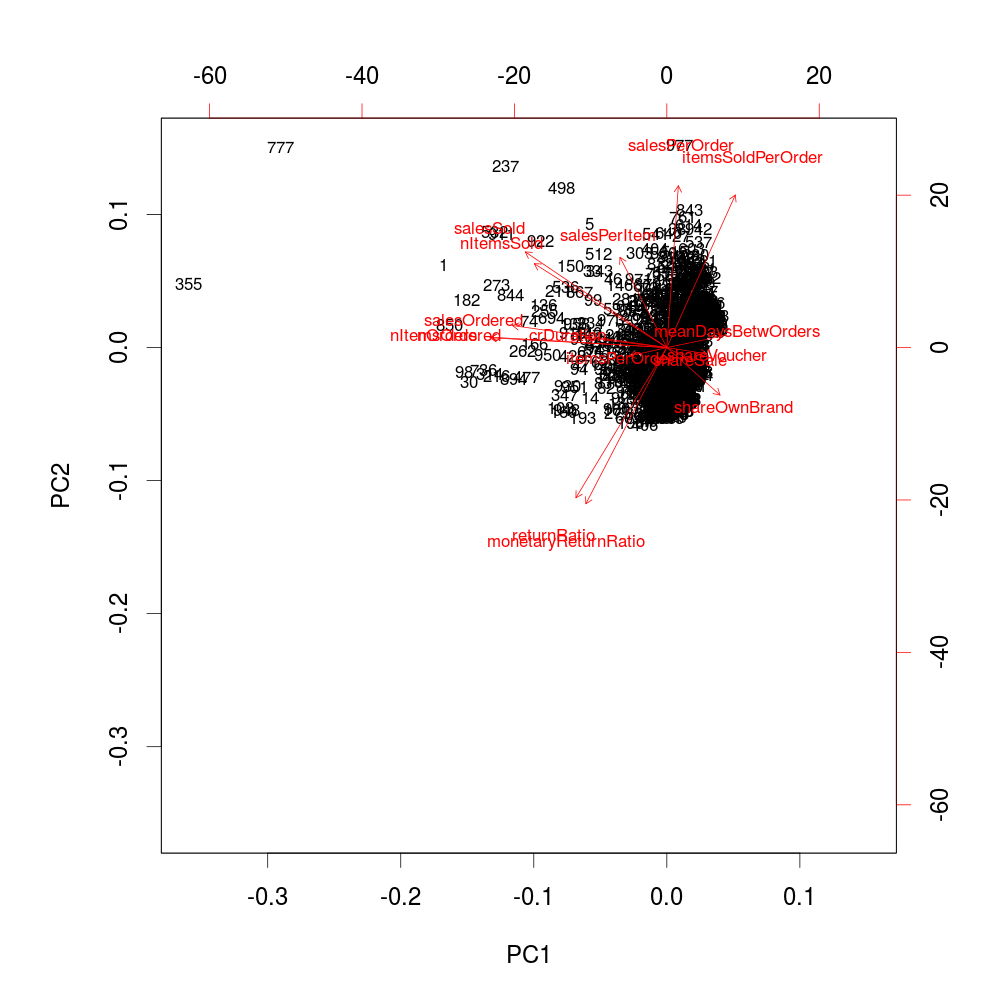
바이플롯

biplot(pcaCust, choices = 1:2, cex = 0.7)
R로 배우는 Machine Learning 기반 마케팅 분석

직접 해보세요!

R로 배우는 Machine Learning 기반 마케팅 분석

Preparing Video For Download...