TrelliscopeJS로 패싯 분할

R에서 Trelliscope로 빅데이터 시각화하기

Ryan Hafen

Author, TrelliscopeJS

TrelliscopeJS로 패싯 분할
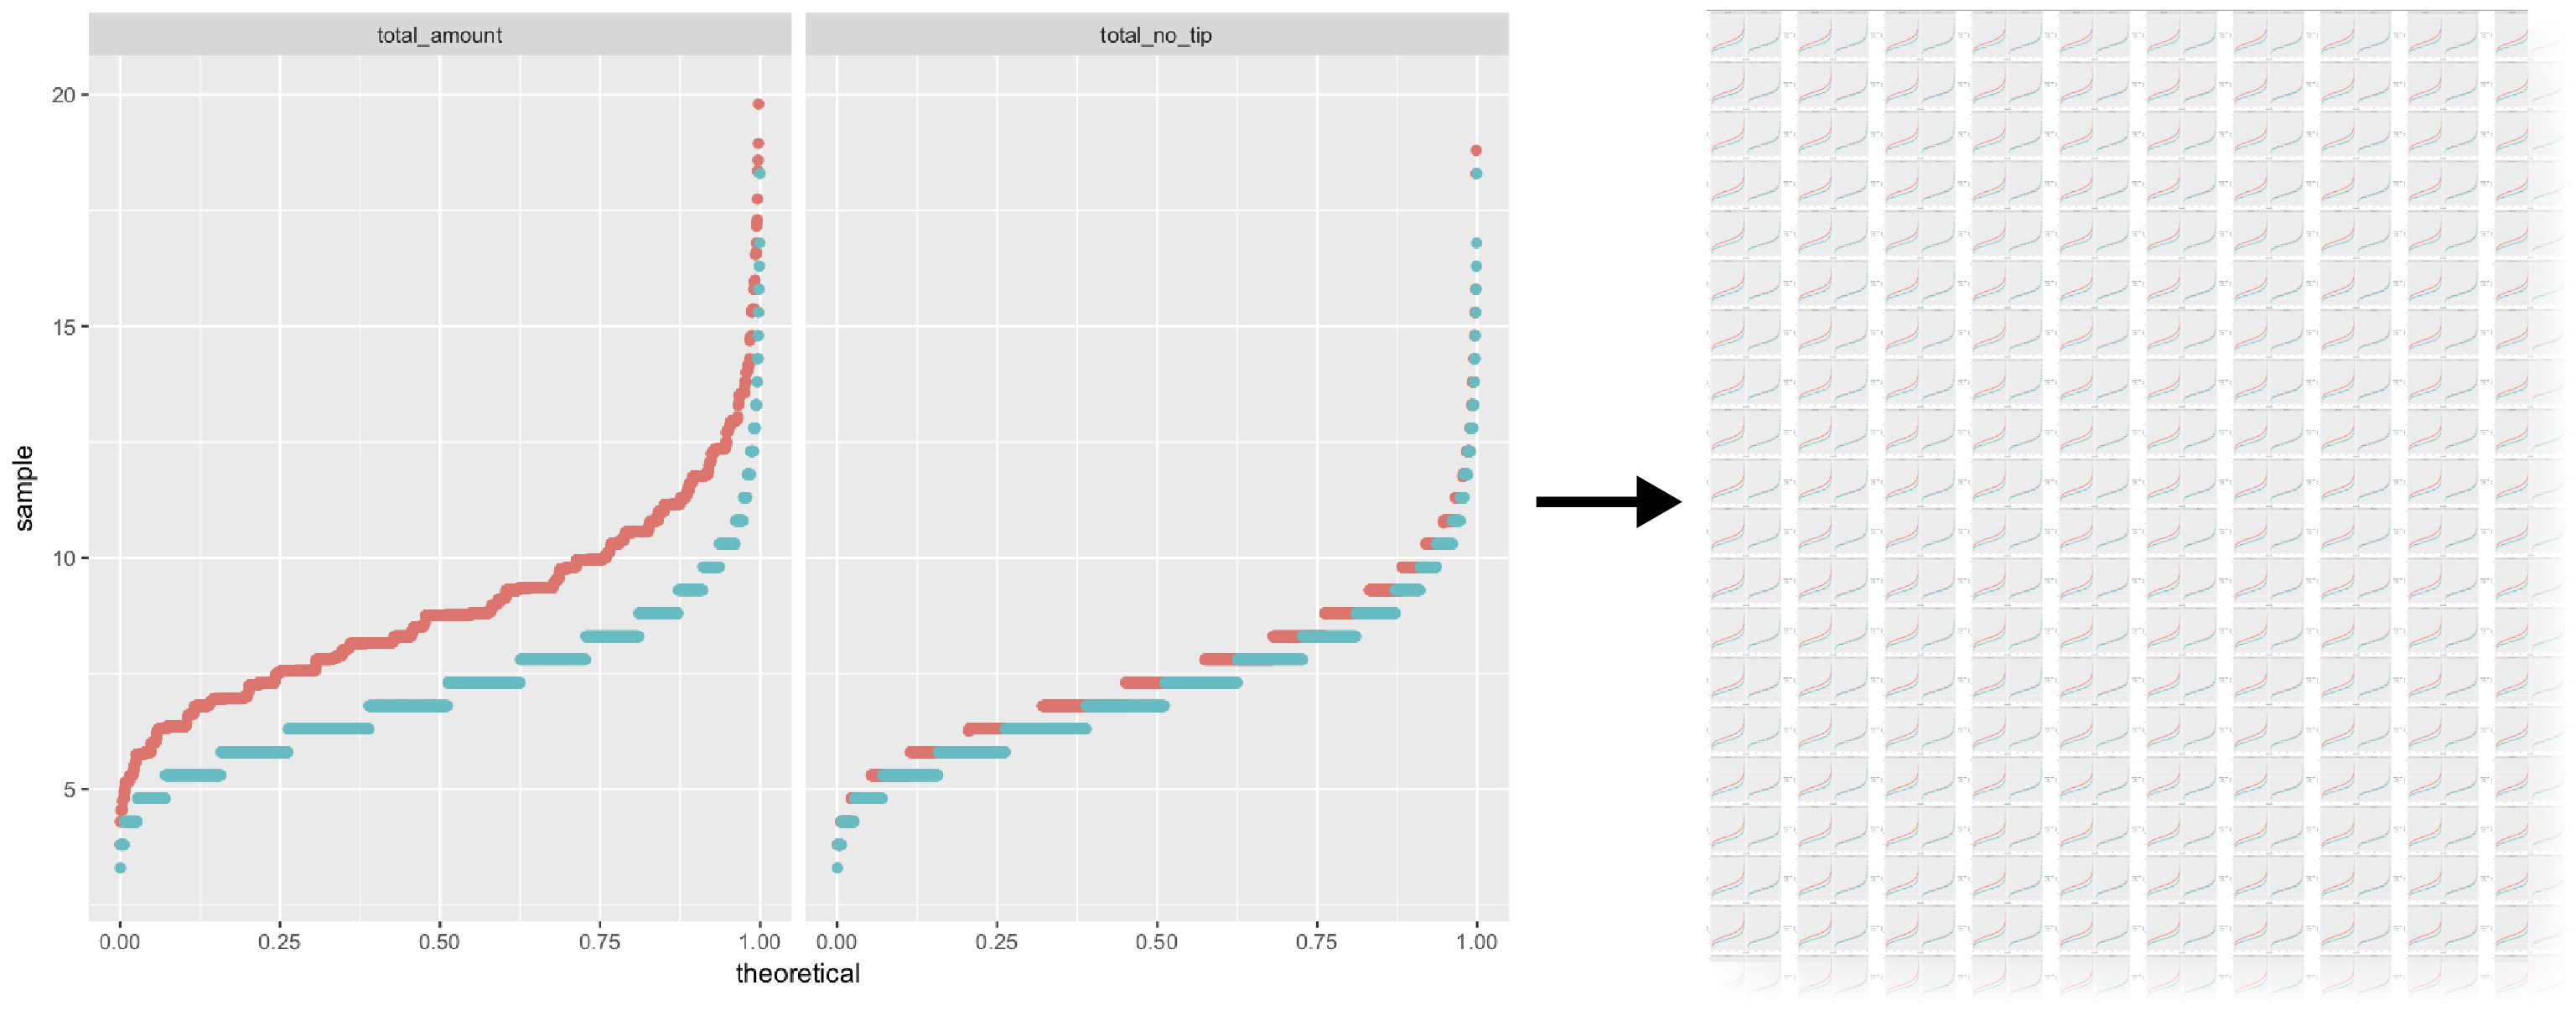
R에서 Trelliscope로 빅데이터 시각화하기

Gapminder 데이터

library(gapminder)
head(gapminder)
# A tibble: 6 x 6
  country     continent  year lifeExp      pop gdpPercap
  <fct>       <fct>     <int>   <dbl>    <int>     <dbl>
1 Afghanistan Asia       1952    28.8  8425333       779
2 Afghanistan Asia       1957    30.3  9240934       821
3 Afghanistan Asia       1962    32.0 10267083       853
4 Afghanistan Asia       1967    34.0 11537966       836
5 Afghanistan Asia       1972    36.1 13079460       740
6 Afghanistan Asia       1977    38.4 14880372       786
R에서 Trelliscope로 빅데이터 시각화하기

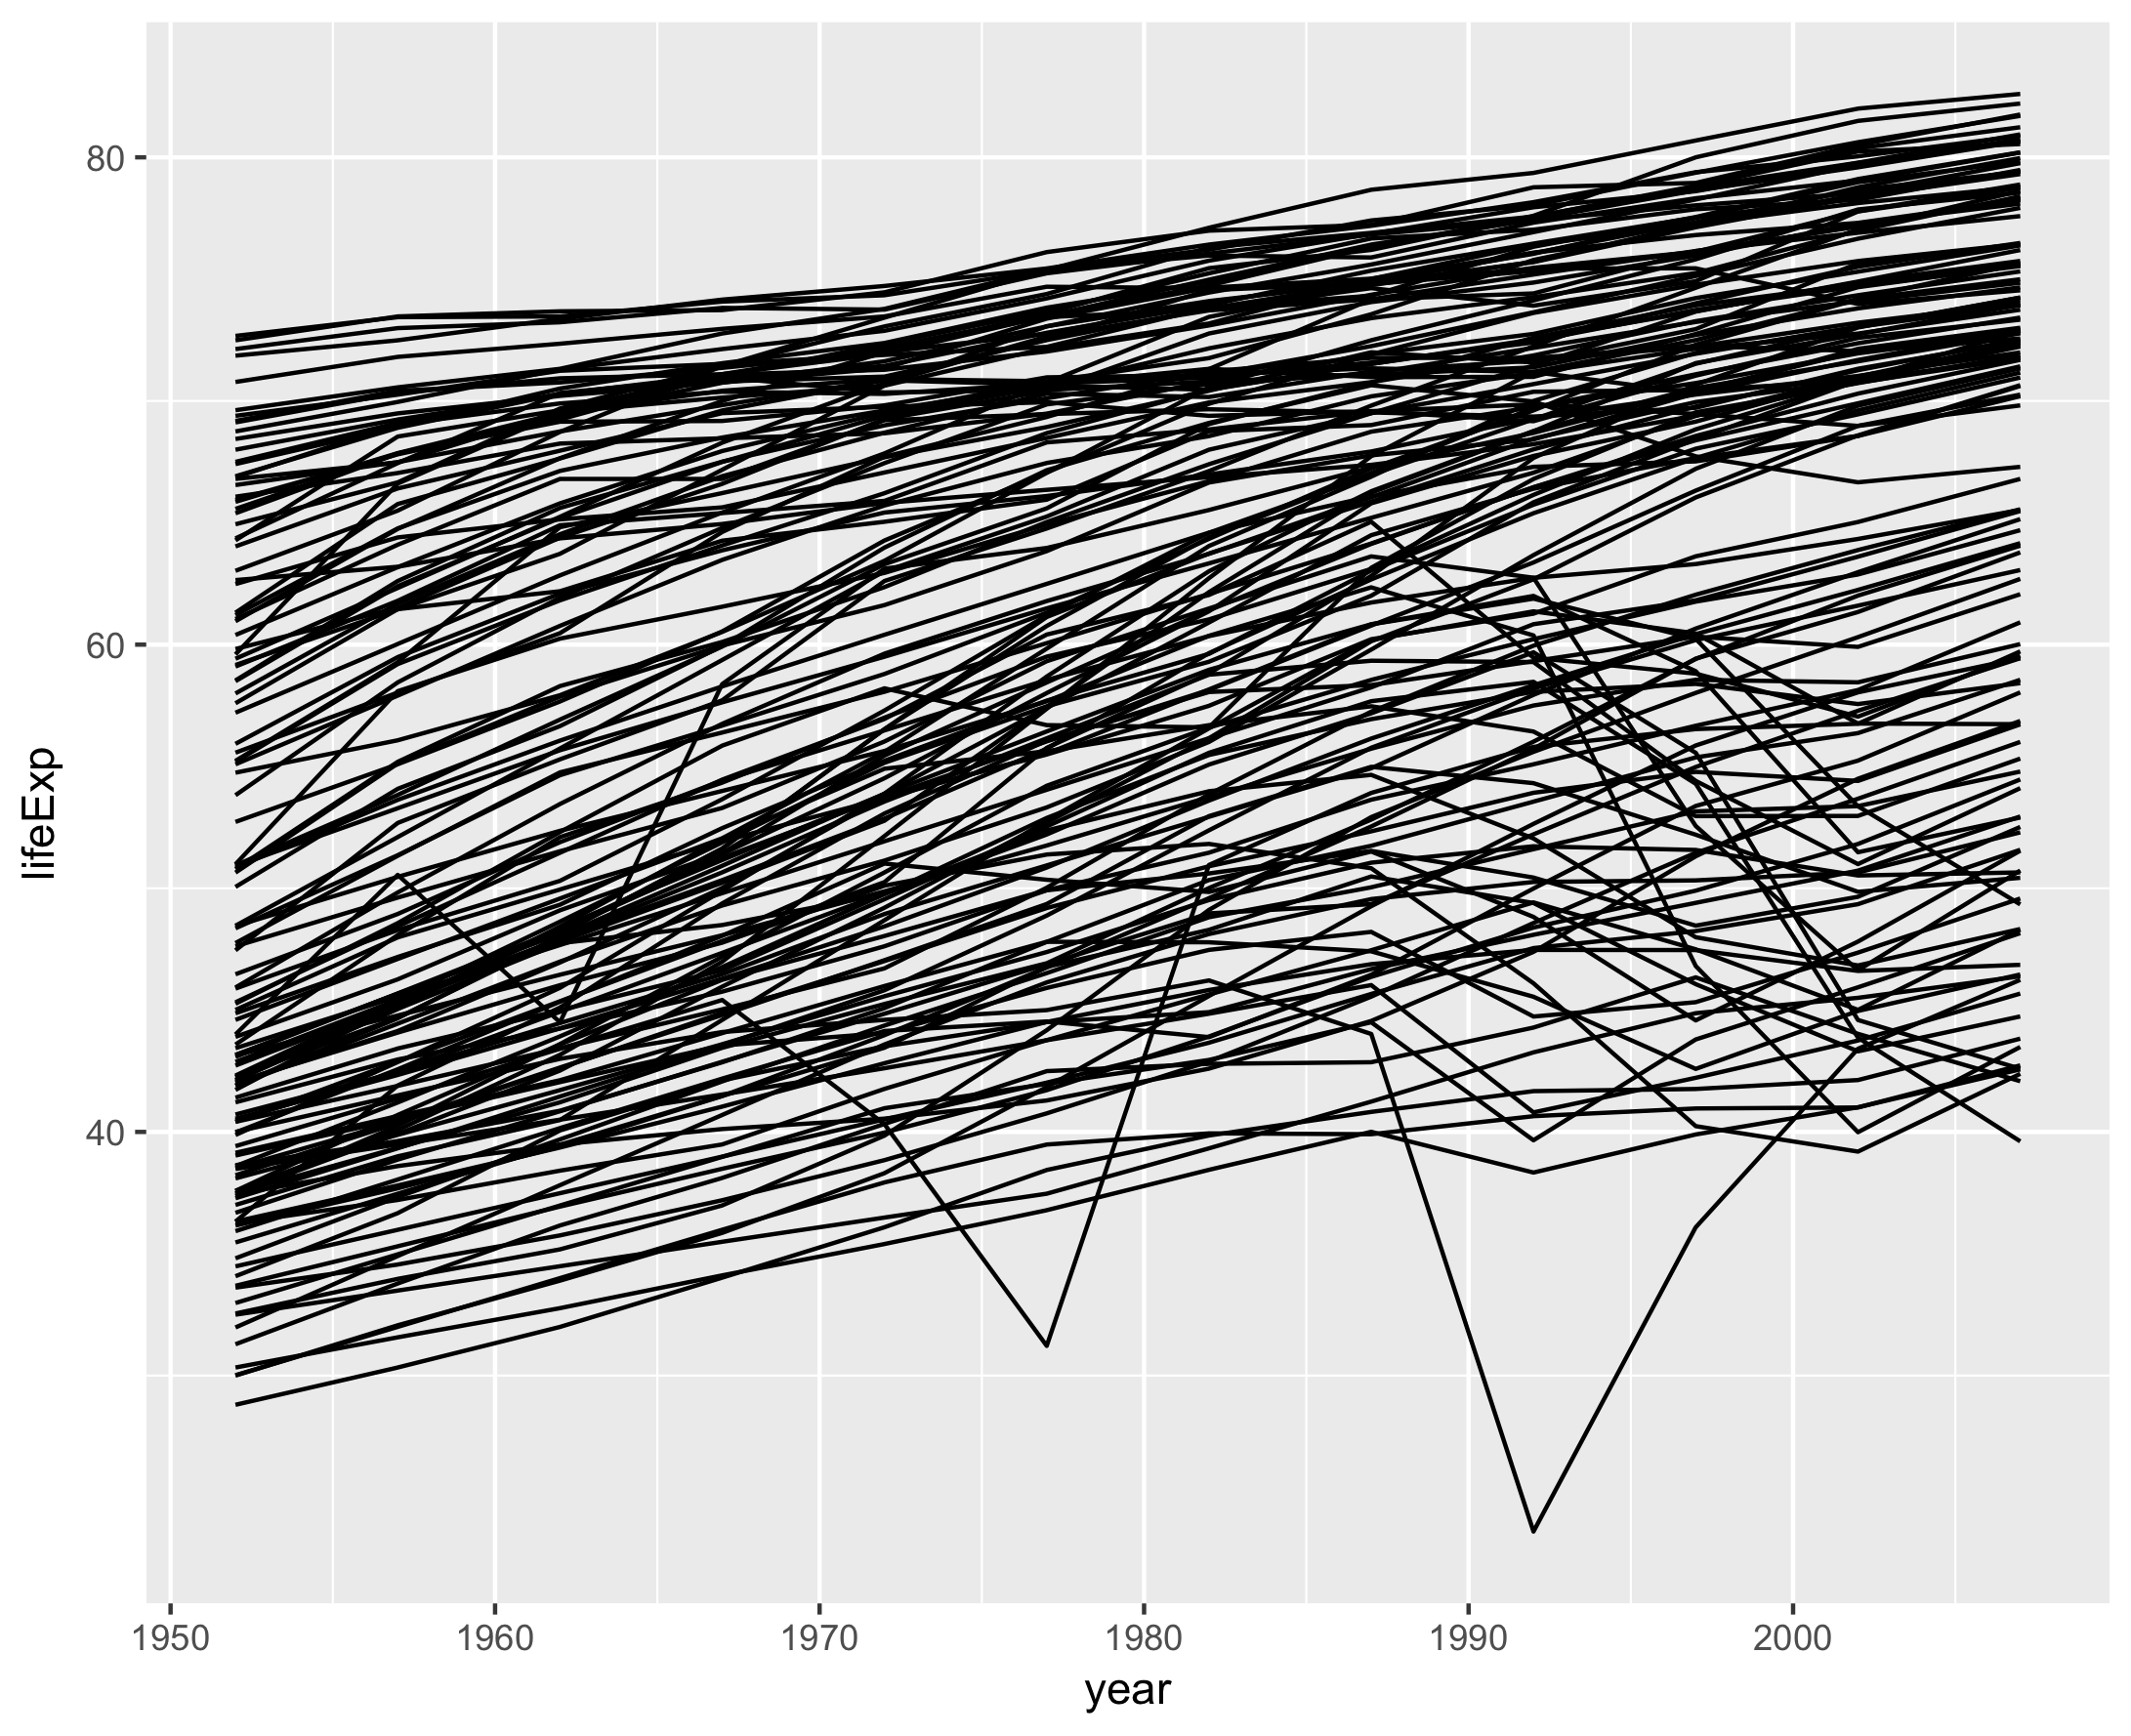
국가별 기대 수명 변화

ggplot(gapminder, aes(year, lifeExp, group = country)) +
  geom_line()
R에서 Trelliscope로 빅데이터 시각화하기

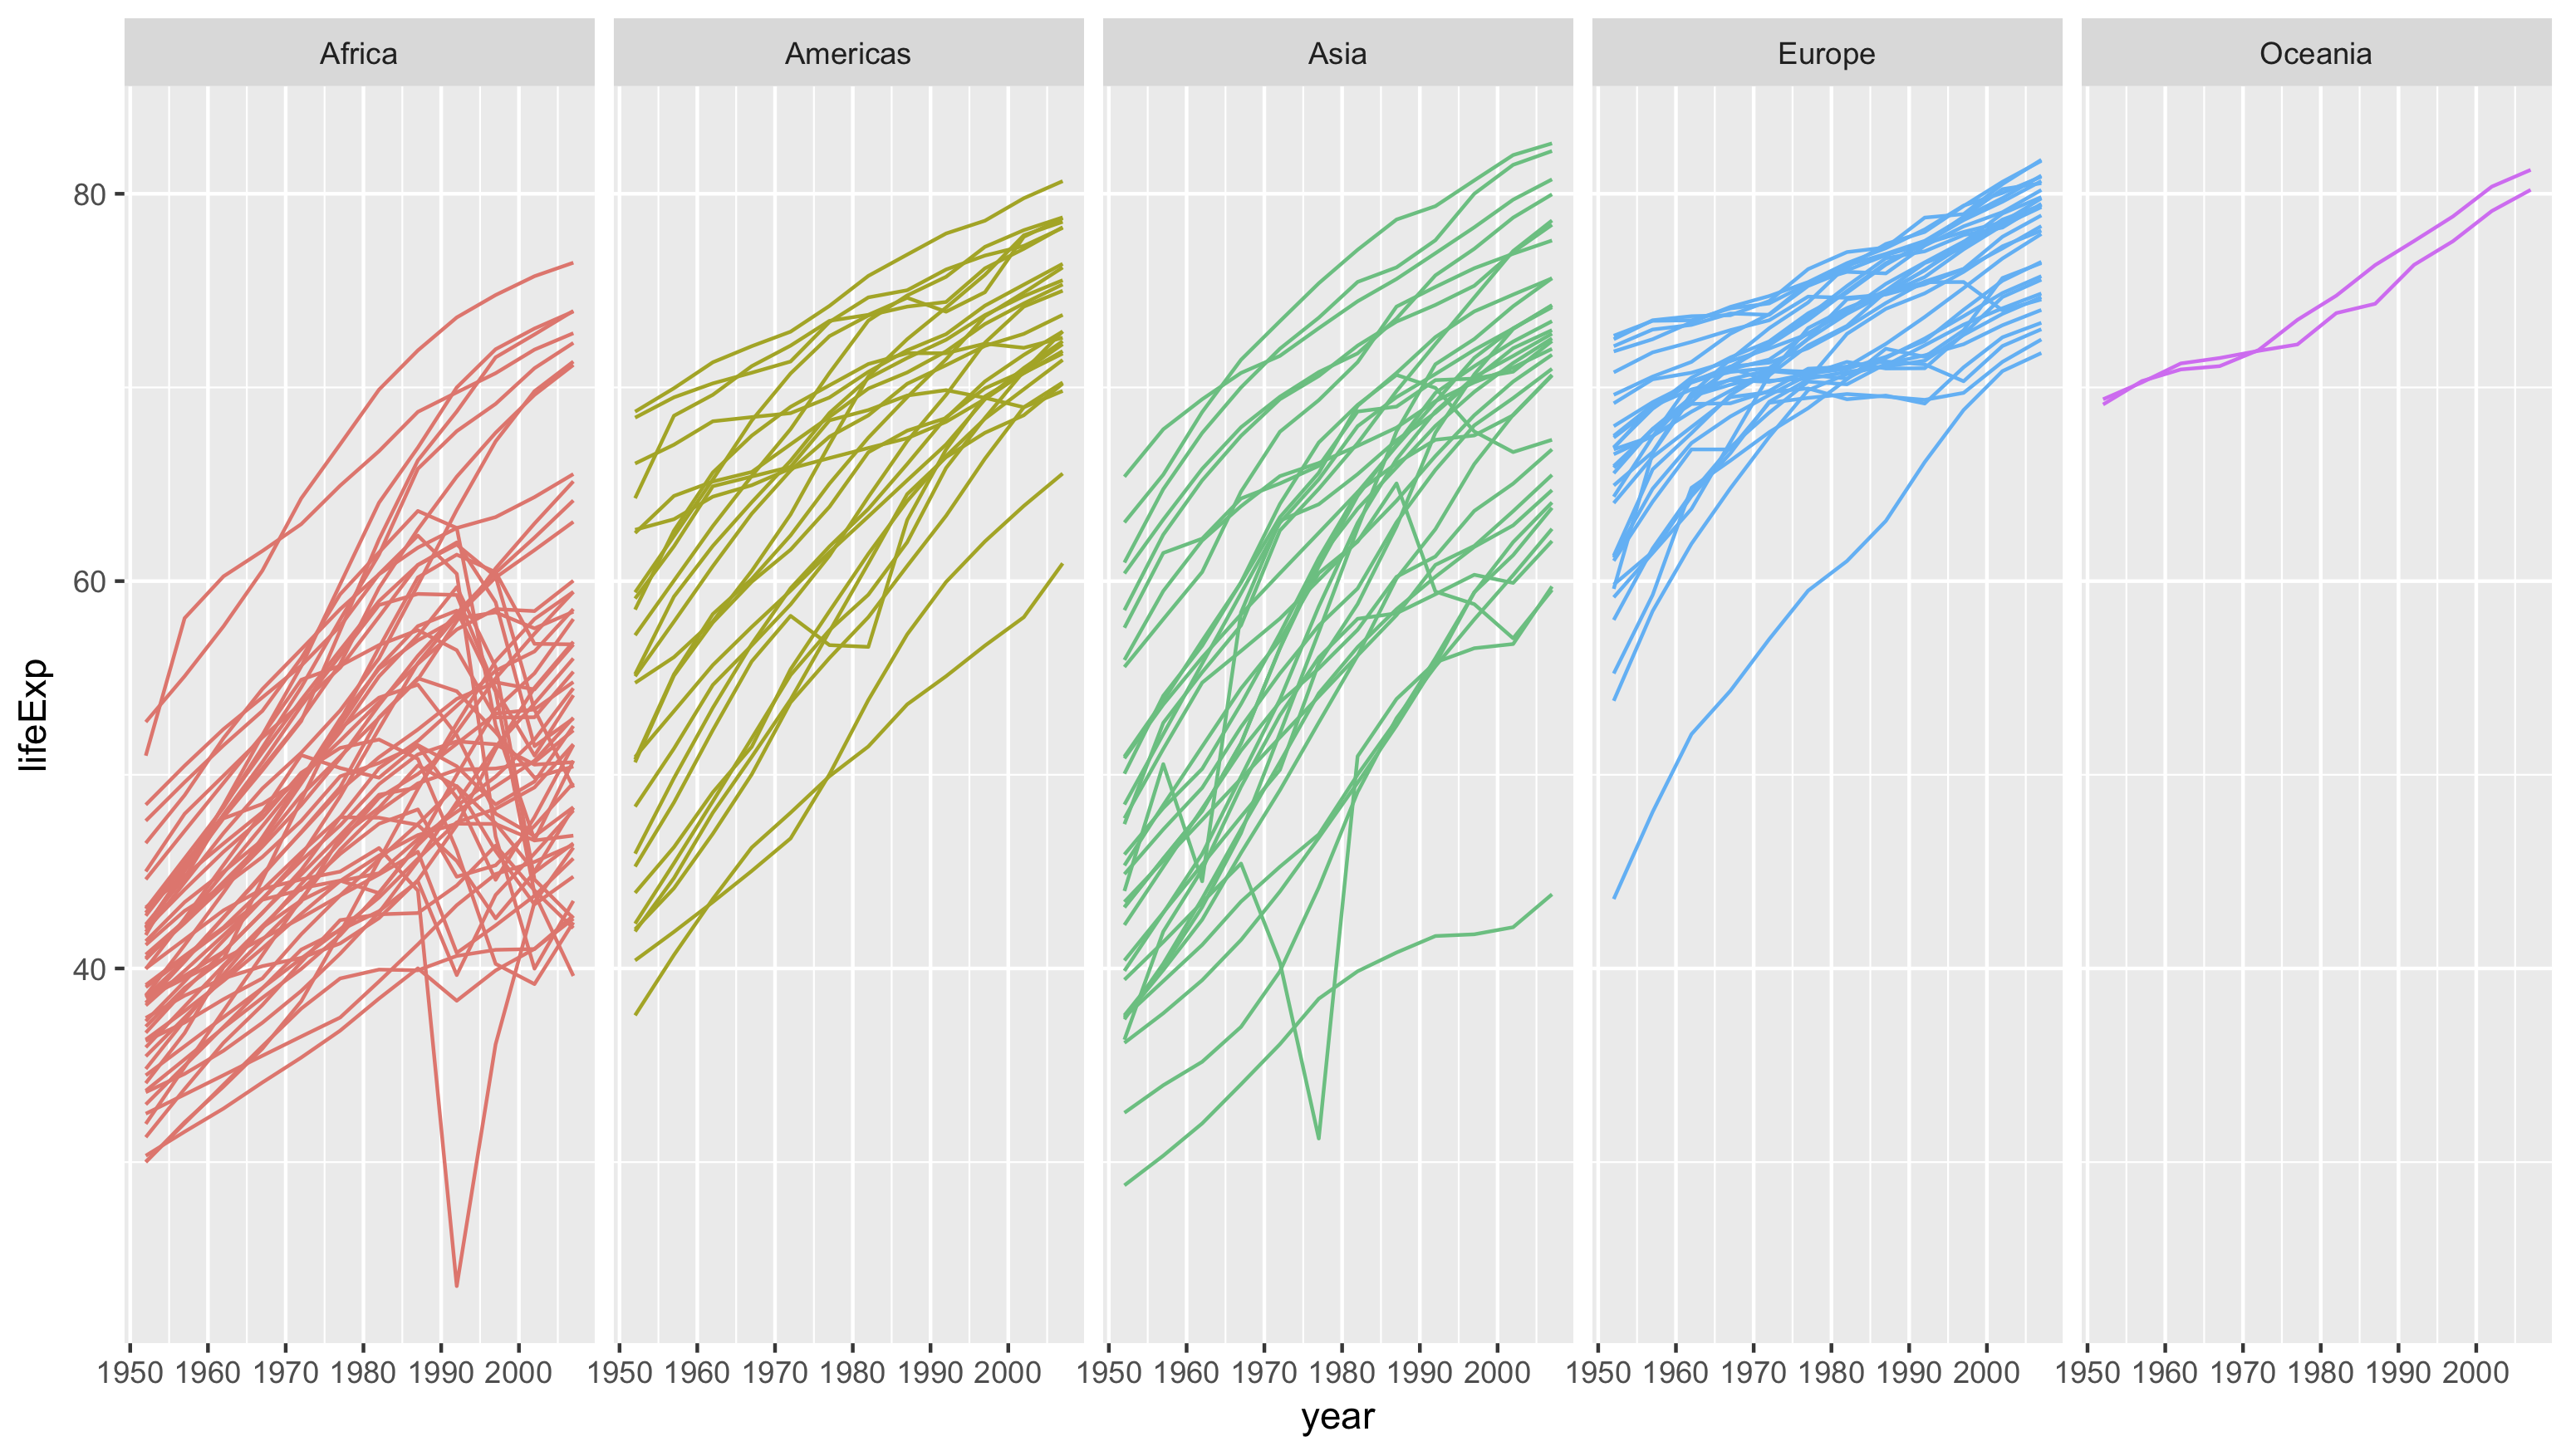
대륙별 패싯 분할

ggplot(gapminder, aes(year, lifeExp, group = country, color = continent)) +
  geom_line() +
  facet_wrap(~ continent, nrow = 1) +
  guides(color = FALSE)
R에서 Trelliscope로 빅데이터 시각화하기

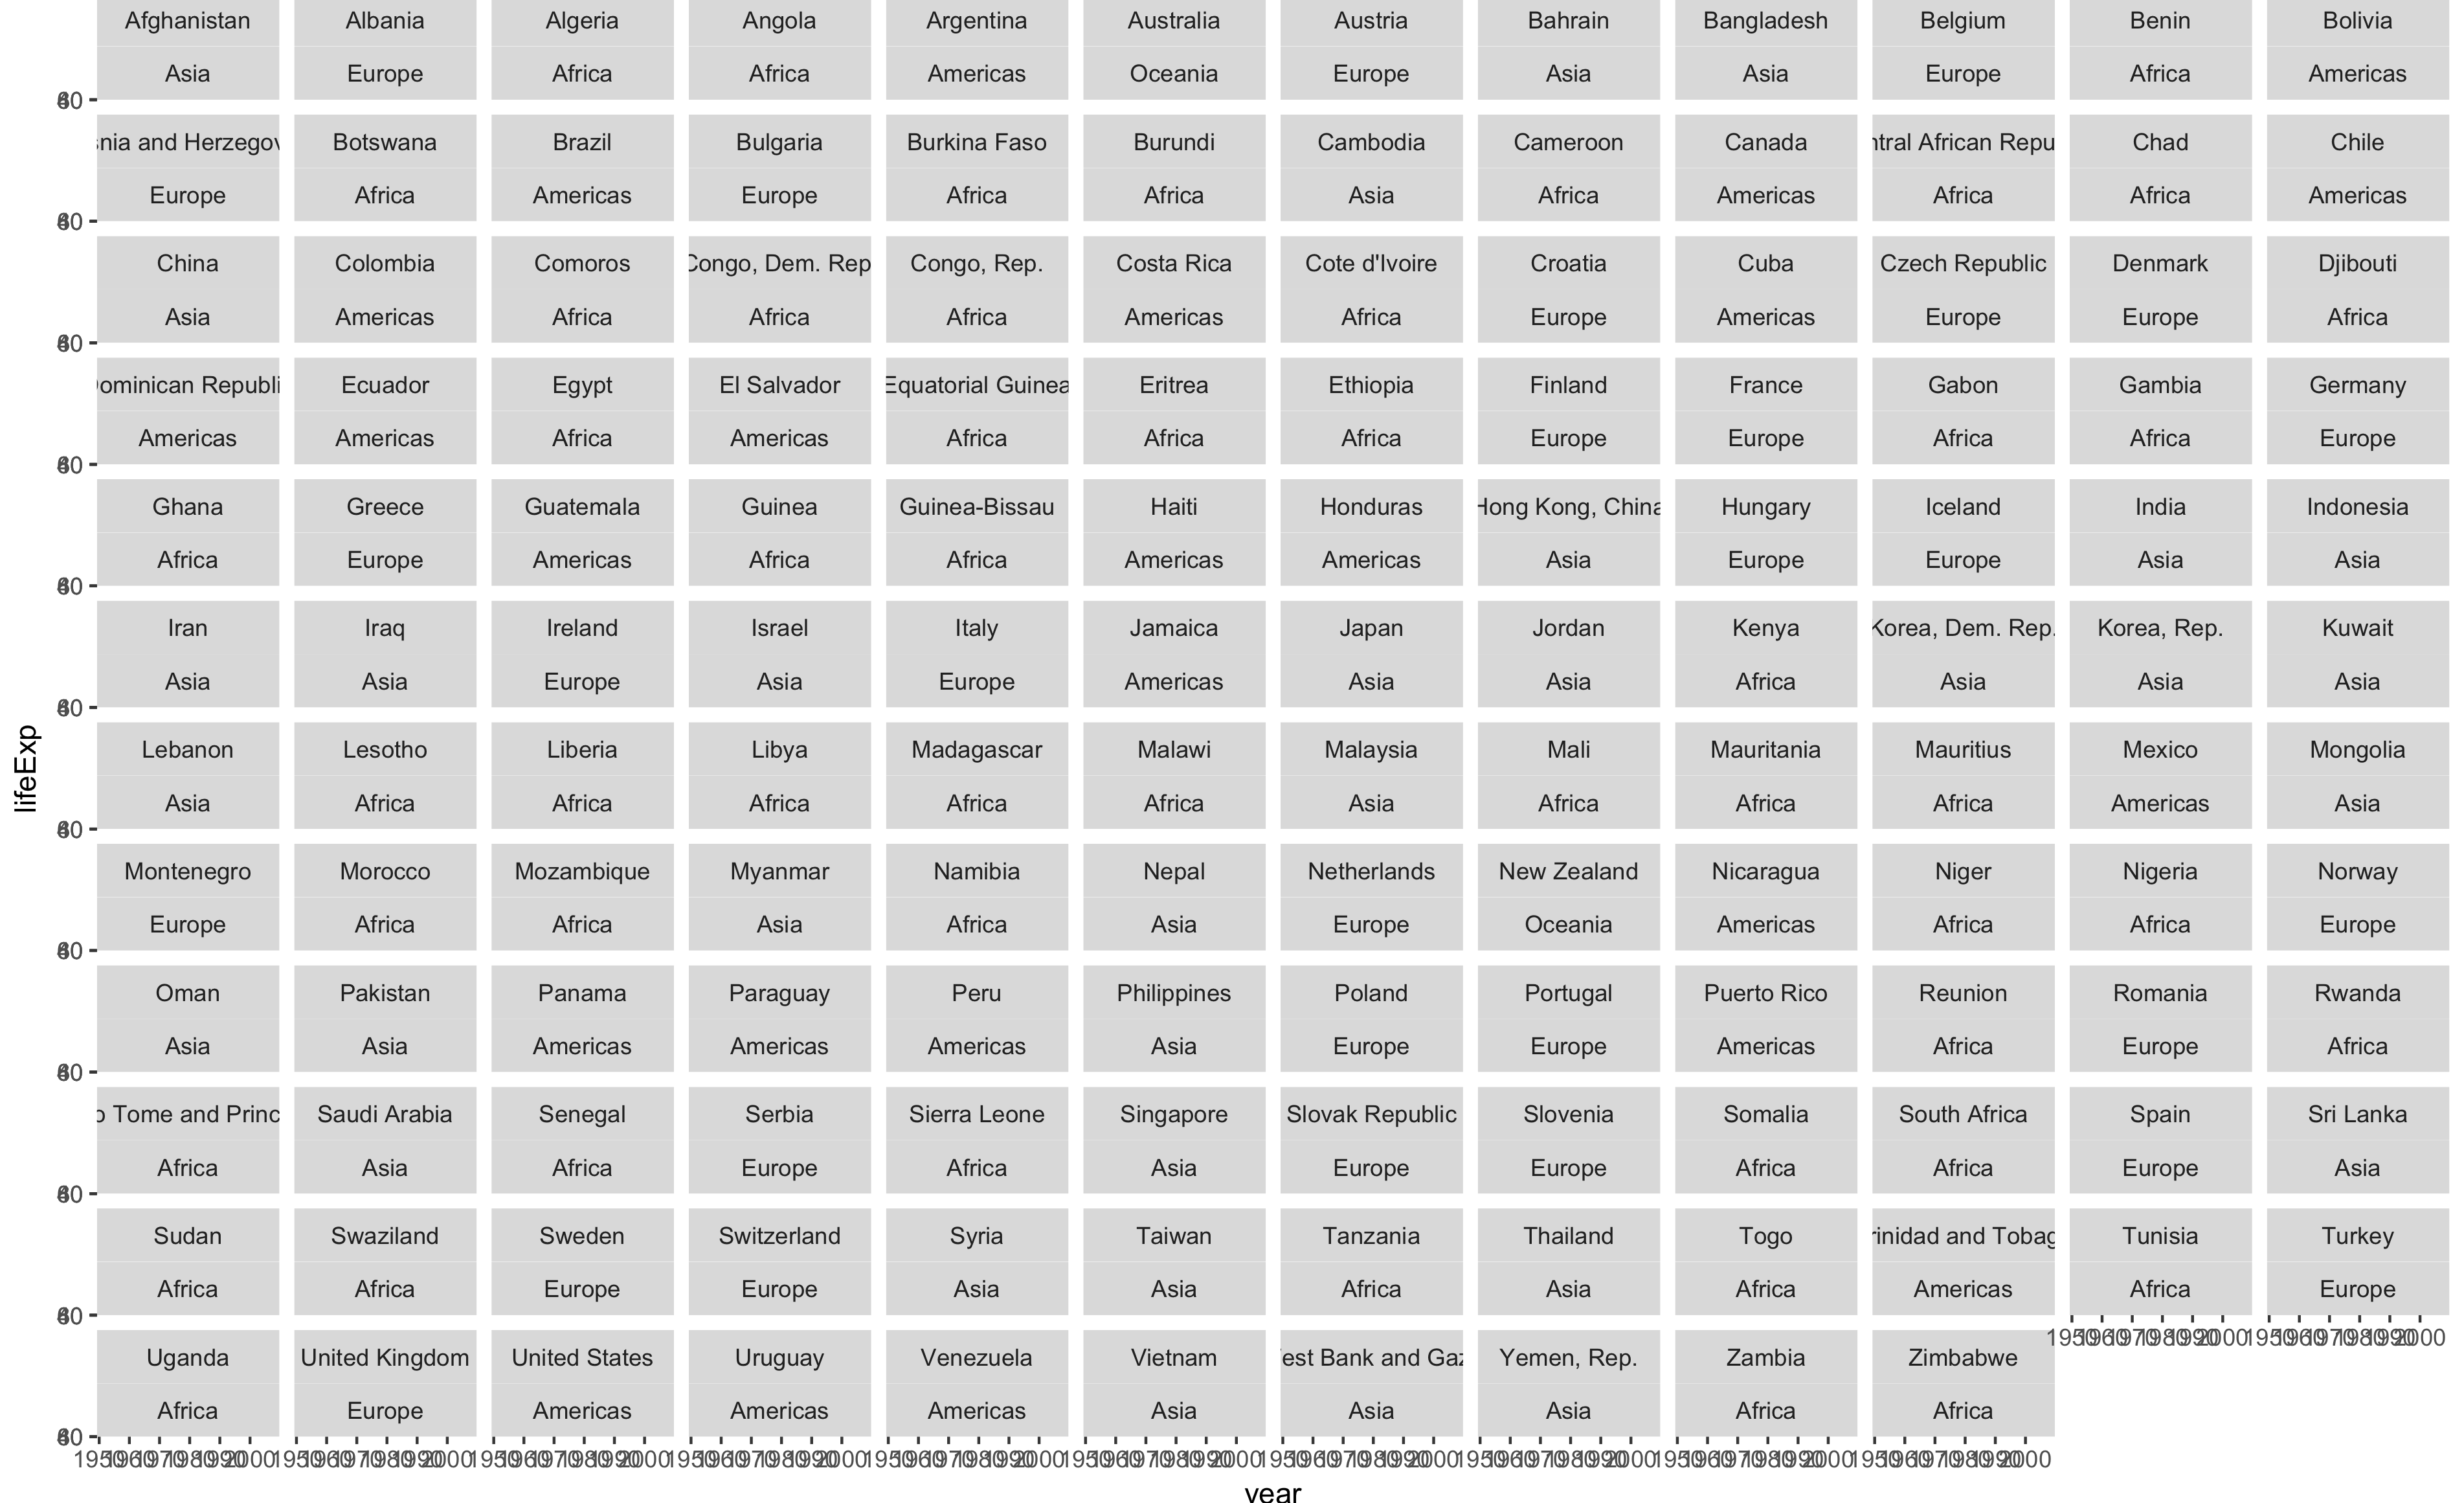
국가별 패싯 분할

ggplot(gapminder, aes(year, lifeExp)) +
  geom_line() +
  facet_wrap(~ country + continent)
R에서 Trelliscope로 빅데이터 시각화하기

TrelliscopeJS로 패싯 분할

facet_wrap()facet_trelliscope()로 바꾸기만 하면 됩니다.

facet_wrap()과 마찬가지로 nrowncol로 행과 열을 제어합니다.

추가 옵션:

  • nrowncol로 그리드 레이아웃 지정(facet_wrap()과 유사).
  • 디스플레이 이름(name)과 설명(desc) 지정.
  • path로 디스플레이 저장 위치 지정.
R에서 Trelliscope로 빅데이터 시각화하기

연습해 봅시다!

R에서 Trelliscope로 빅데이터 시각화하기

Preparing Video For Download...