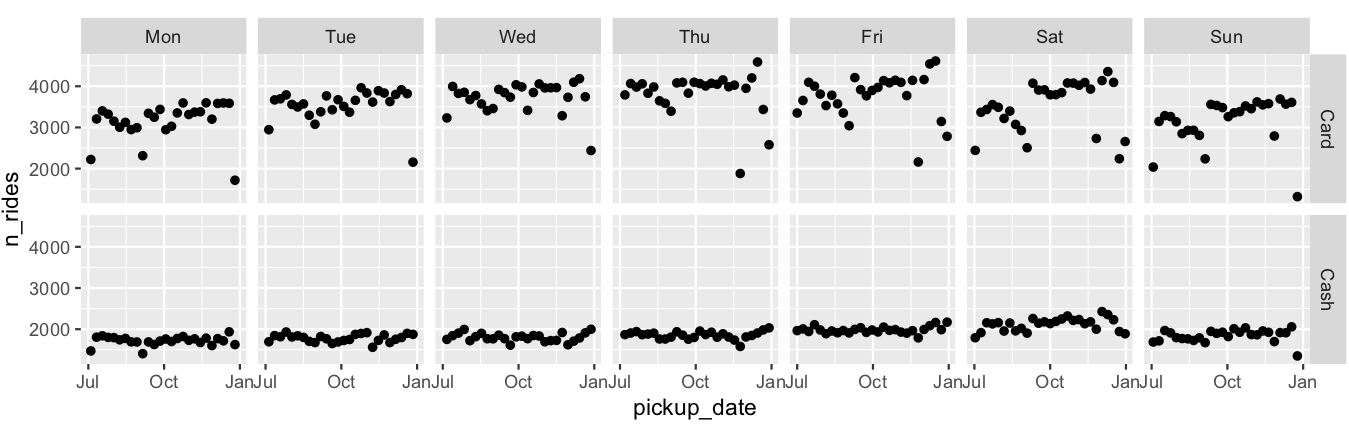
Trelliscope 옵션
R에서 Trelliscope로 빅데이터 시각화하기

Ryan Hafen
Author, TrelliscopeJS
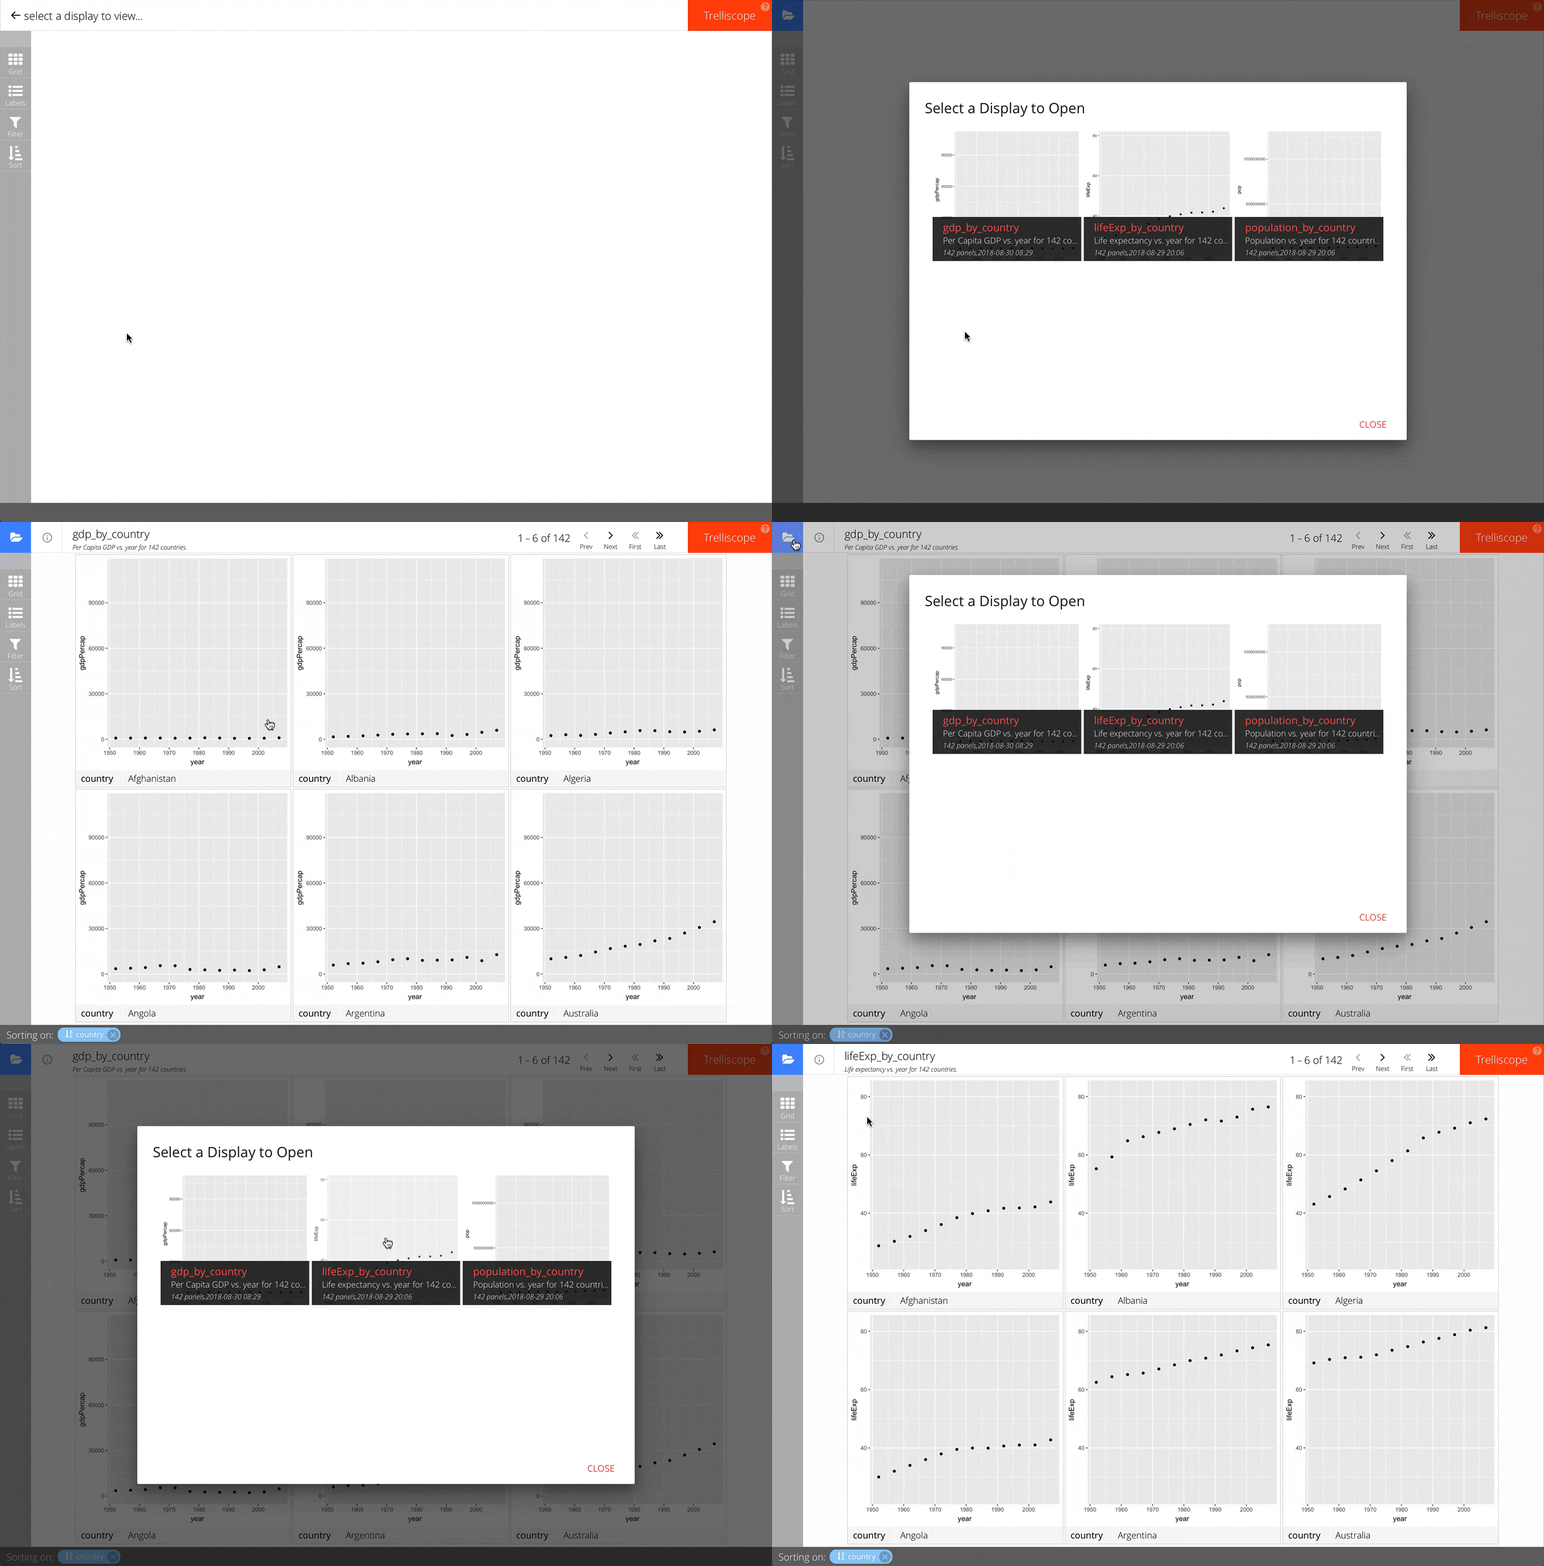
출력 디렉터리 지정
trelliscope(dat, path = "...", ...)ggplot(...) + ... + facet_trelliscope(path = "...", ...)
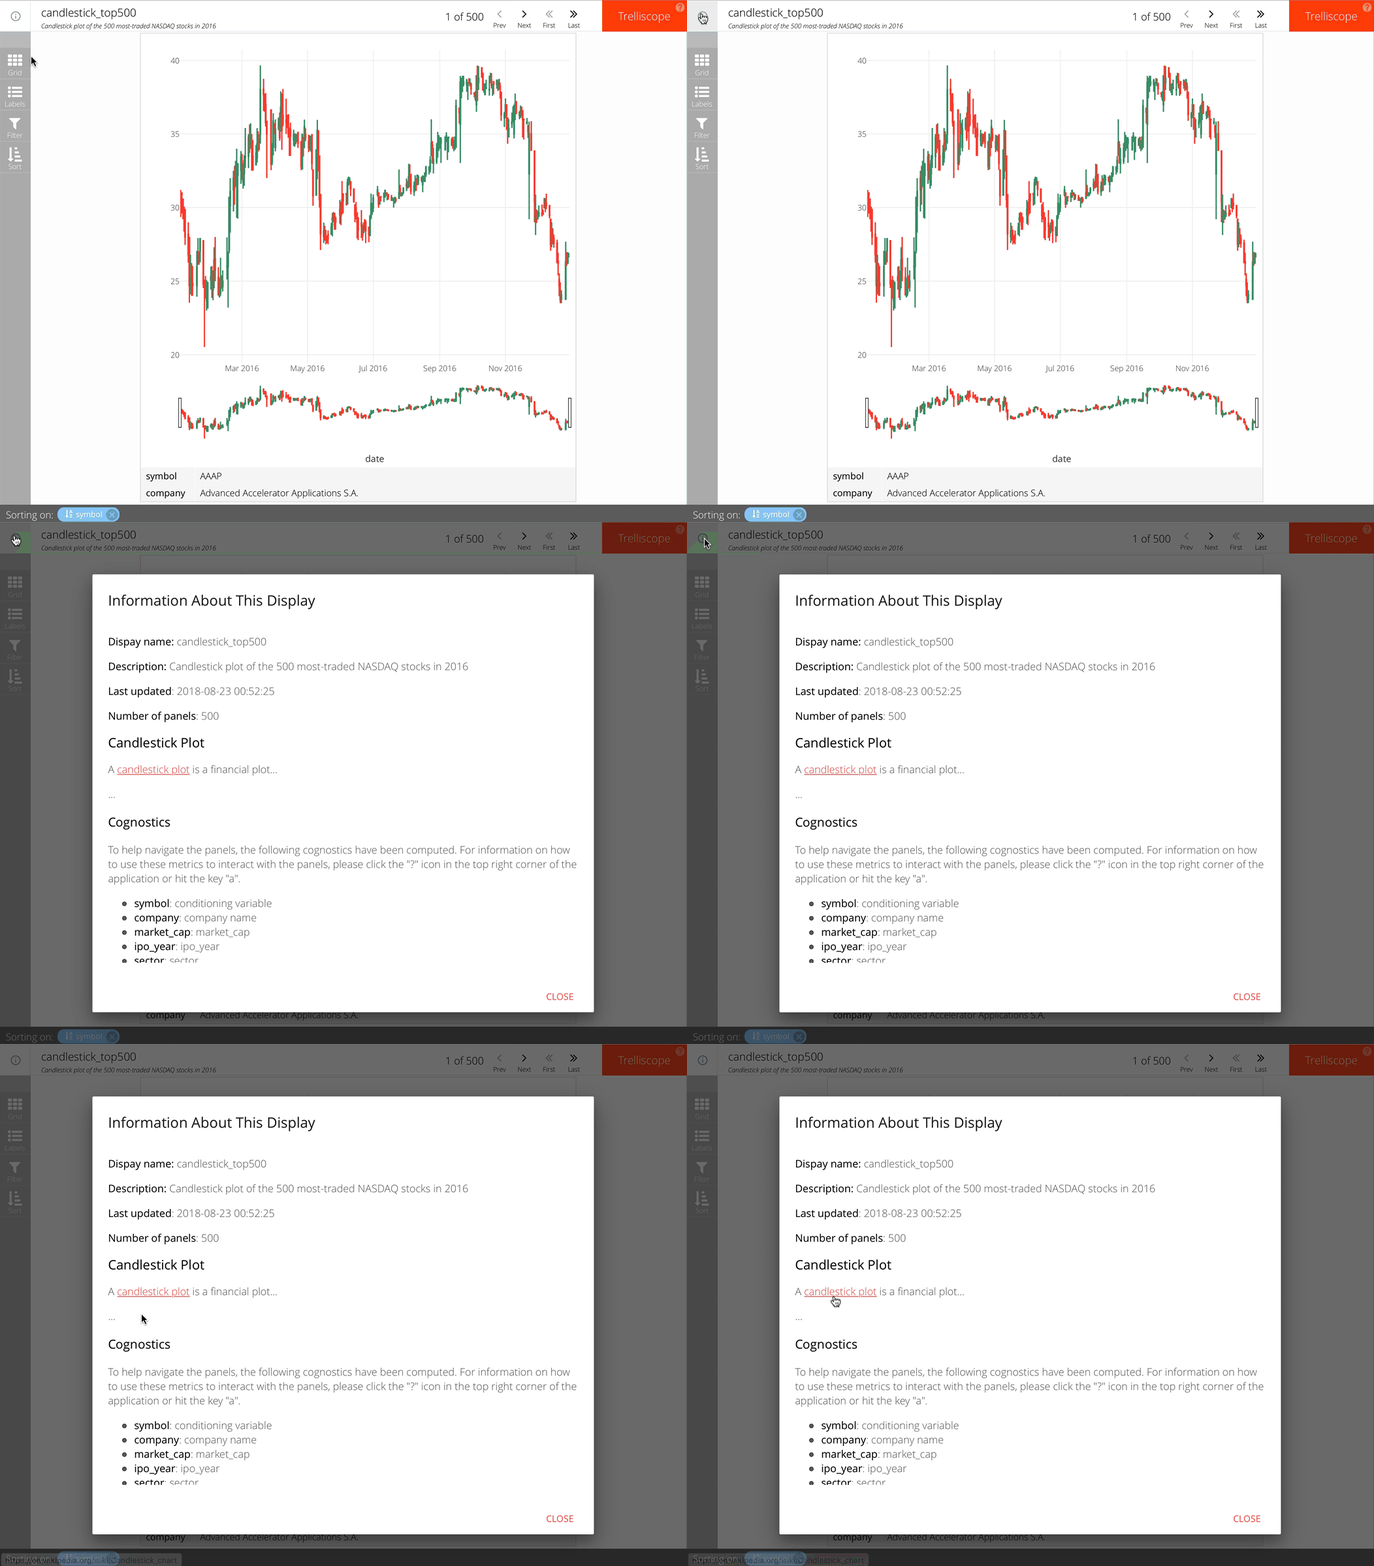
trelliscope(by_symbol,
  name = "candlestick_top500",
  desc = "Candlestick plot of the 500 most-traded NASDAQ stocks in 2016",
  md_desc = "
## Candlestick Plot
A [candlestick plot](https://en.wikipedia.org/wiki/Candlestick_chart)
is a financial plot...
..." )
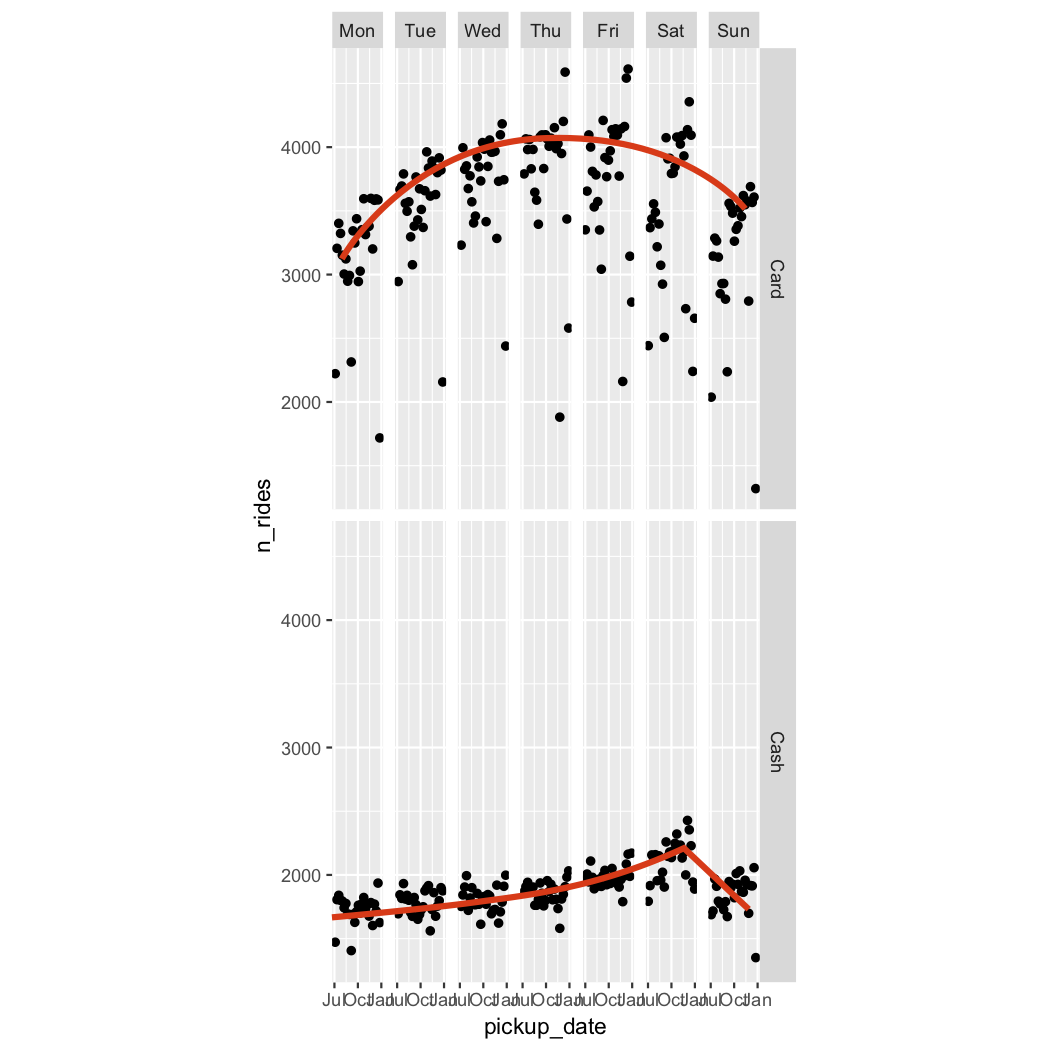
플롯 종횡비
플롯 종횡비