dplyr로 하는 프로그래밍
Dr. Chester Ismay
Educator, Data Scientist, and R/Python Consultant
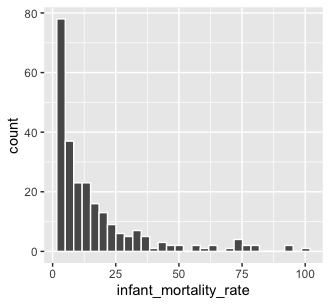
library(ggplot2)
ggplot(
    world_bank_data,
    aes(x = infant_mortality_rate)
) +

  geom_histogram(color = "white")
library(ggplot2) ggplot( world_bank_data, aes(x = infant_mortality_rate) ) +
geom_histogram(color = "white")
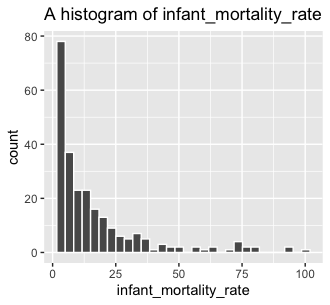
ggplot(
    world_bank_data,
    aes(x = infant_mortality_rate)
) +
  geom_histogram(color = "white") +

  ggtitle("A histogram of infant_mortality_rate")
ggplot( world_bank_data, aes(x = infant_mortality_rate) ) + geom_histogram(color = "white") +
ggtitle("A histogram of infant_mortality_rate")
# 이전 플롯 코드
ggplot(world_bank_data, aes(x = infant_mortality_rate)) +
  geom_histogram(color = "white") +
  ggtitle("A histogram of infant_mortality_rate")
# 함수 정의
my_histogram <- function(

    df, x_var) {

  ggplot(df, aes(x = x_var)) +
    geom_histogram(color = "white") +
    ggtitle(paste("A histogram of", x_var))
}
# 함수 정의 my_histogram <- function(
df, x_var) {
ggplot(df, aes(x = x_var)) + geom_histogram(color = "white") + ggtitle(paste("A histogram of", x_var)) }
# 함수 첫 시도
my_histogram <- function(df, x_var) {
  ggplot(df, aes(x = x_var)) +
    geom_histogram(color = "white") +
    ggtitle(paste("A histogram of", x_var))
}

# 함수 호출
my_histogram(df = world_bank_data,
             x_var = infant_mortality_rate)
# 함수 첫 시도 my_histogram <- function(df, x_var) { ggplot(df, aes(x = x_var)) + geom_histogram(color = "white") + ggtitle(paste("A histogram of", x_var)) }
# 함수 호출 my_histogram(df = world_bank_data, x_var = infant_mortality_rate)
 Error in paste("A histogram of", x_var) :
  object 'infant_mortality_rate' not found
# 오류를 막기 위한 수정
my_histogram <- function(df, x_var) {
  ggplot(df, aes(x = {{ x_var }})) +

    geom_histogram(color = "white") +
    ggtitle(paste("A histogram of",

            as_label(enquo(x_var)))
}
# 오류를 막기 위한 수정 my_histogram <- function(df, x_var) { ggplot(df, aes(x = {{ x_var }})) +
geom_histogram(color = "white") + ggtitle(paste("A histogram of",
as_label(enquo(x_var))) }
# rlang 연산자를 쓴 함수
my_histogram <- function(df, x_var) {
  ggplot(df, aes(x = {{ x_var }})) +
    geom_histogram(color = "white") +
    ggtitle(paste(
      "A histogram of",
      as_label(enquo(x_var))
    ))
}

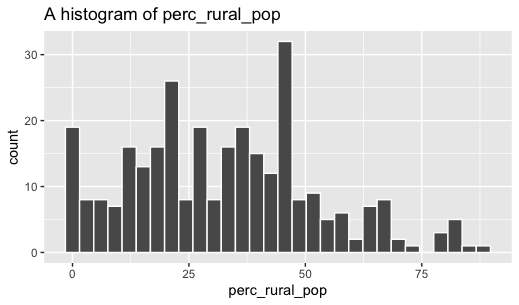
# 파이프로 함수 호출!
world_bank_data %>%
  my_histogram(x_var = perc_rural_pop)
# rlang 연산자를 쓴 함수 my_histogram <- function(df, x_var) { ggplot(df, aes(x = {{ x_var }})) + geom_histogram(color = "white") + ggtitle(paste( "A histogram of", as_label(enquo(x_var)) )) }
# 파이프로 함수 호출! world_bank_data %>% my_histogram(x_var = perc_rural_pop)