텍스트로 소통하기
Bokeh로 배우는 인터랙티브 데이터 시각화

George Boorman
Core Curriculum Manager, DataCamp
현재 플롯
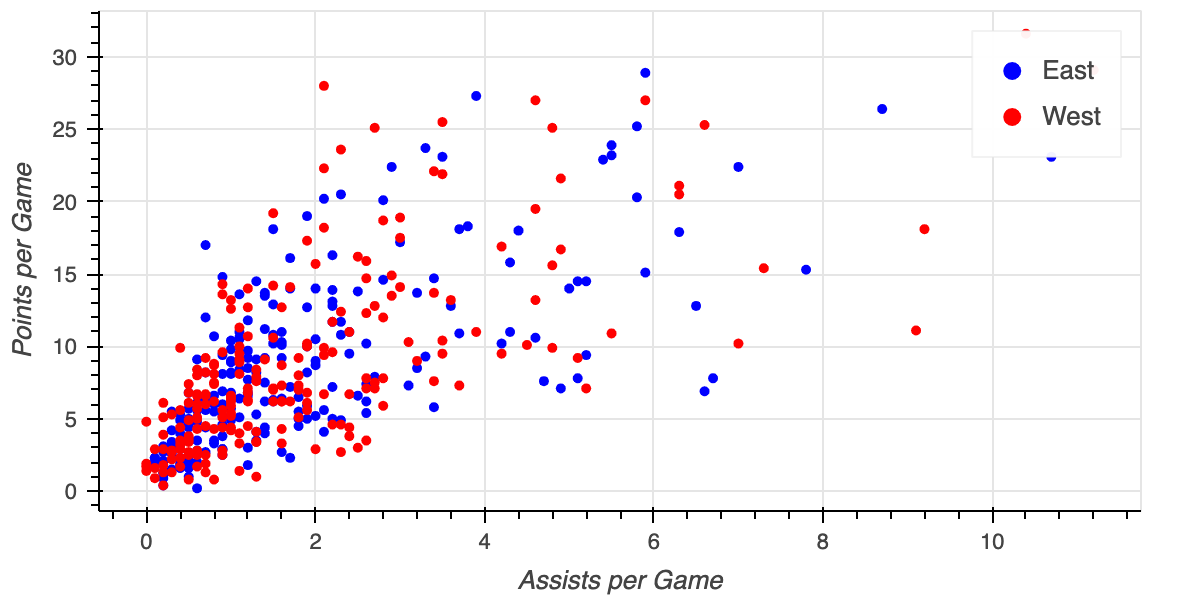
제목 추가하기
fig = figure(x_axis_label='Assists per Game', y_axis_label='Points per Game',title="Points vs. Assists by Conference")fig.circle(x='assists', y='points', source=east, color='blue', legend_label='East') fig.circle(x='assists', y='points', source=west, color='red', legend_label='West') output_file(filename="points_vs_assists_by_conference.html") show(fig)
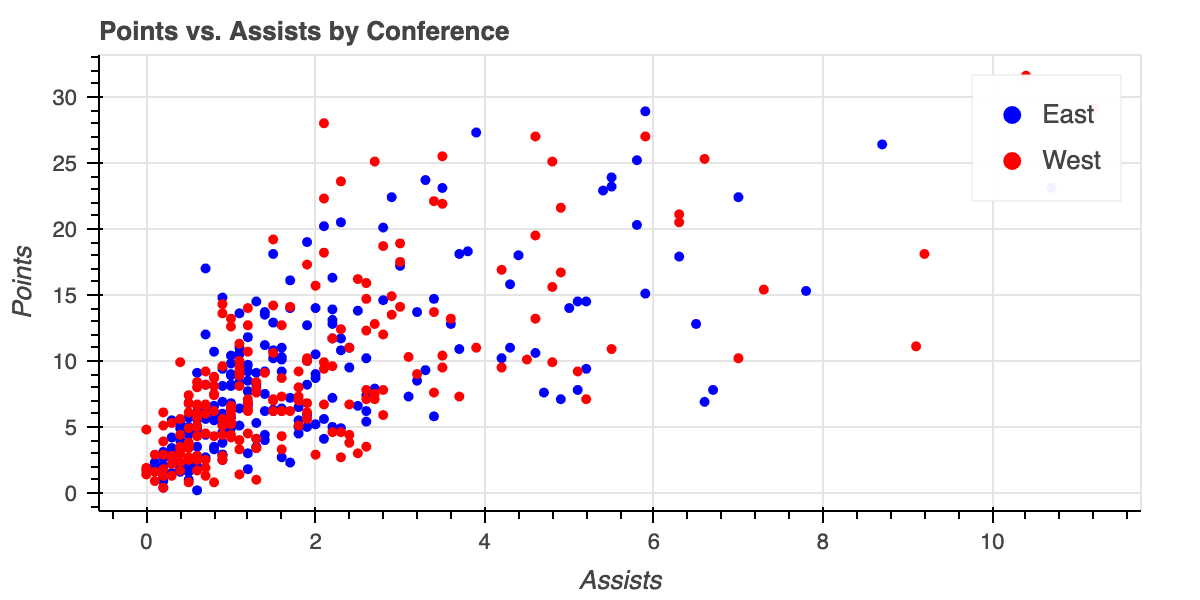
제목 사용자 지정
fig.title.text_font_size = "30px"fig.title.align = "center"output_file(filename="modified_title.html") show(fig)
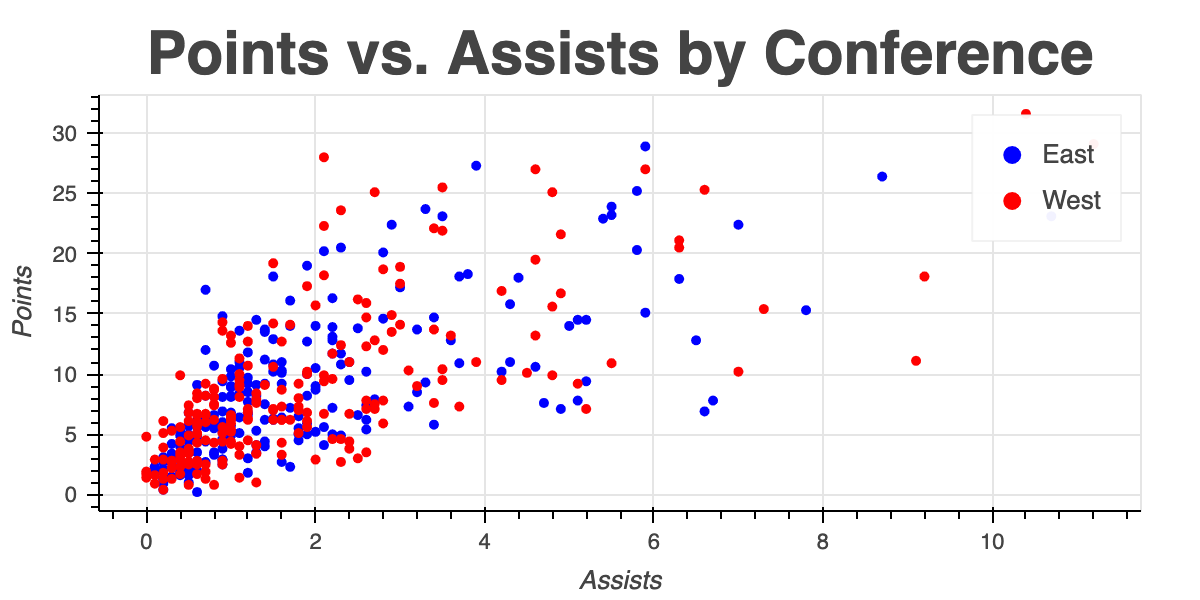
범례 수정
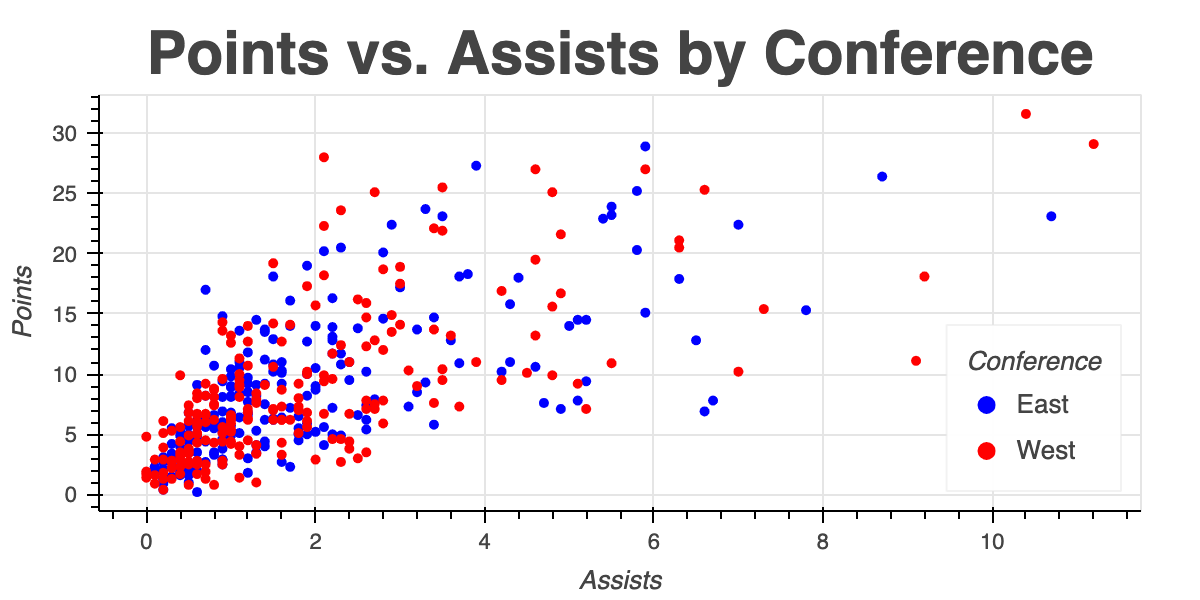
범례 제목 글꼴 스타일
fig.legend.title_text_font_style = "normal"output_file(filename="normal_legend_title.html") show(fig)
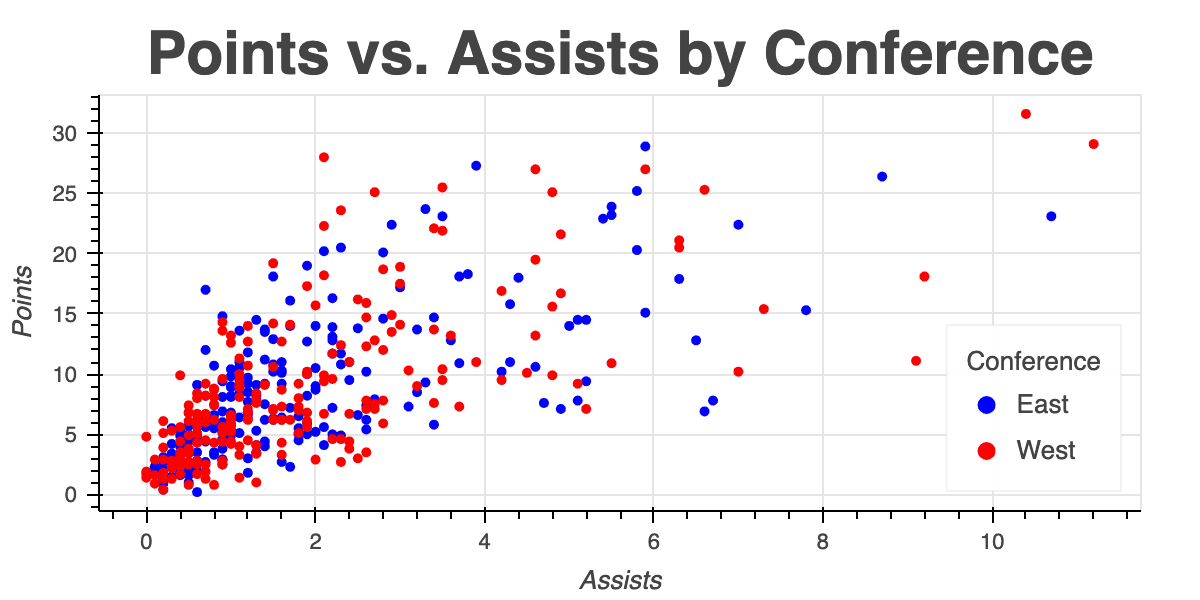
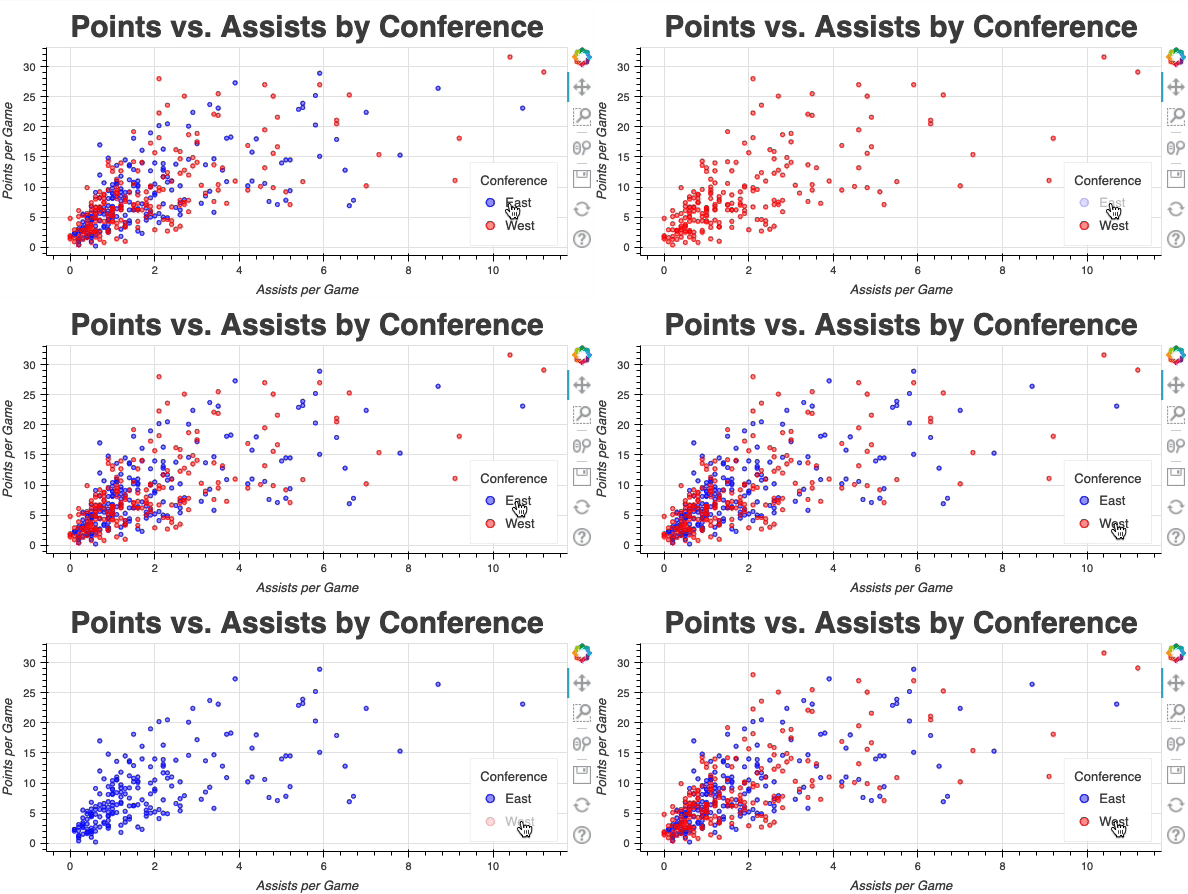
대화형 범례 표시
fig.legend.click_policy = "hide"output_file(filename="interactive_legend.html") show(fig)