범주형 데이터 시각화

Bokeh로 배우는 인터랙티브 데이터 시각화

George Boorman

Core Curriculum Manager, DataCamp

범주형 데이터

  • 범주형 데이터는 미리 정해진 옵션이나 레이블을 갖는 데이터입니다.

    • 예: 성별, 출생국가
  • 요인은 범주형 변수의 다른 용어입니다

print(nba[["position", "team", "conference"]].head())
    position    team    conference
0   PG          OKC     West
1   PG          HOU     West
2   PG          BOS     East
3   C           NO      West
4   SG          TOR     East
Bokeh로 배우는 인터랙티브 데이터 시각화

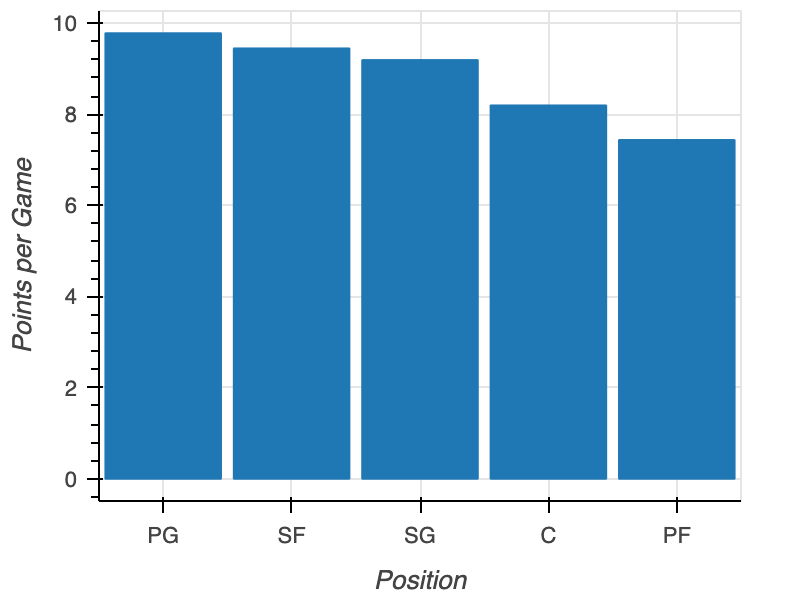
정렬

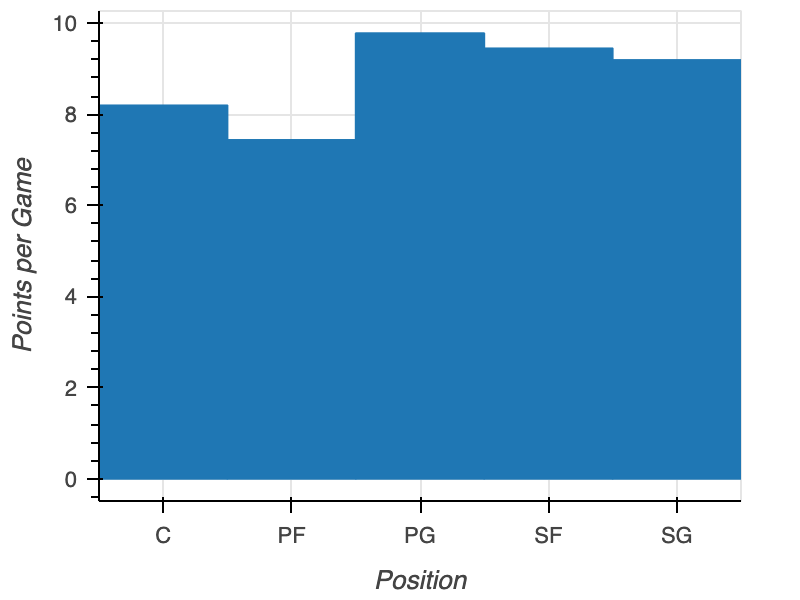
정렬되지_않은_막대그래프

pos = nba.groupby("position")["points"].mean()
pos = pos.sort_values("points", ascending=False)

fig = figure(x_range=pos["position"], x_axis_label="Position", y_axis_label="Points per Game") fig.vbar(x=pos["position"], top=pos["points"]) output_file(filename="sorted_plot.html") show(fig)
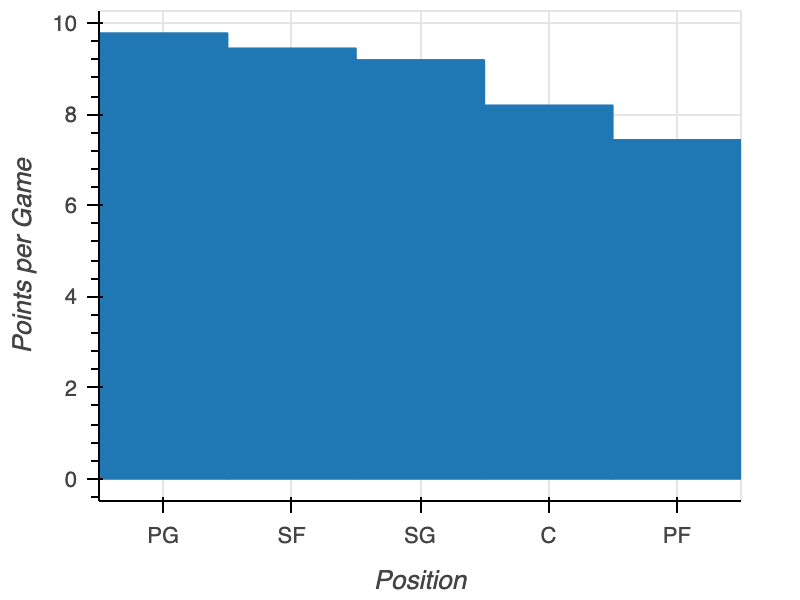
정렬된_막대그래프

Bokeh로 배우는 인터랙티브 데이터 시각화

패딩

fig = figure(x_range=nba["position"], 
             x_axis_label="Position", 
             y_axis_label="Points per Game")
fig.vbar(x=nba["position"], top=nba["points"],

width=0.9)
output_file(filename="padded_plot.html") show(fig)

패딩_적용_막대그래프

Bokeh로 배우는 인터랙티브 데이터 시각화

방향

fig = figure(x_range=nba['position'], 
             x_axis_label="Position", 
             y_axis_label="Points per Game")
fig.vbar(x=nba["position"], top=nba["points"], width=0.9)

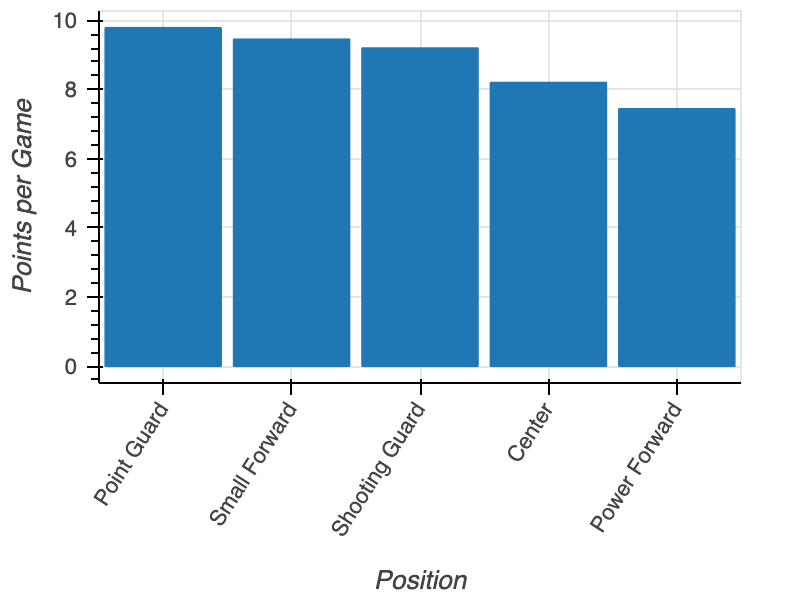
fig.xaxis.major_label_orientation = 45
output_file(filename="rotated_x_label_plot.html") show(fig)
Bokeh로 배우는 인터랙티브 데이터 시각화

회전된 x축 레이블

회전된_라벨_막대그래프

Bokeh로 배우는 인터랙티브 데이터 시각화

중첩 범주

positions = ["Point Guard", "Shooting Guard", 
            "Small Forward", "Power Forward", "Center"]
conferences = ["East", "West"]

factors = [("Point Guard", "East"), ("Point Guard", "West"), ("Shooting Guard", "East"), ("Shooting Guard", "West"), ("Small Forward", "East"), ("Small Forward", "West"), ("Power Forward", "East"), ("Power Forward", "West"), ("Center", "East"), ("Center", "West")]
Bokeh로 배우는 인터랙티브 데이터 시각화

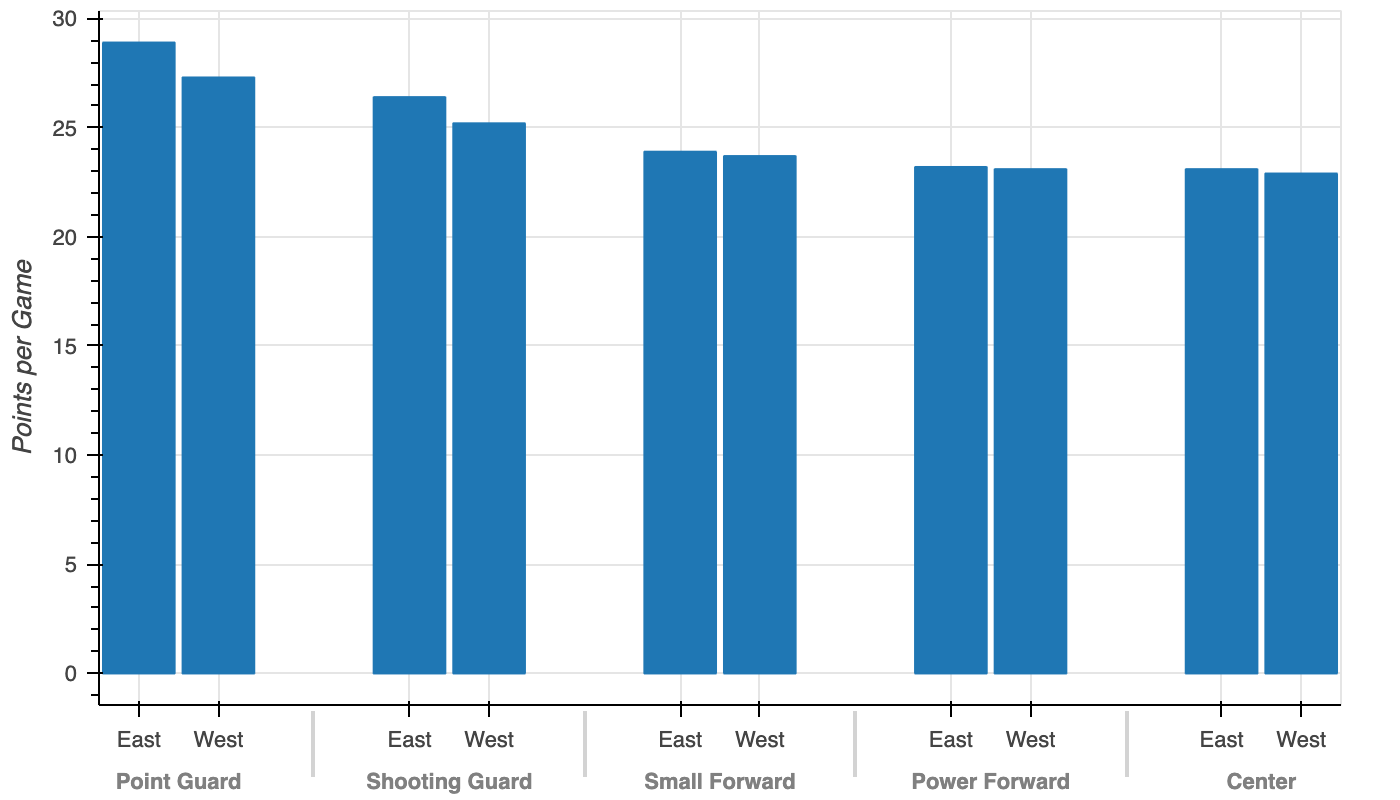
그룹 막대그래프 만들기

from bokeh.models import FactorRange

fig = figure(x_range=FactorRange(*factors), y_axis_label="Points per Game")
fig.vbar(x=factors, top=nba["points"], width=0.9)
output_file(filename="grouped_bar_plot.html") show(fig)
Bokeh로 배우는 인터랙티브 데이터 시각화

그룹 막대그래프

그룹_막대그래프

Bokeh로 배우는 인터랙티브 데이터 시각화

연습해 봅시다!

Bokeh로 배우는 인터랙티브 데이터 시각화

Preparing Video For Download...