import datetime as dt
from bokeh.models import PolyAnnotation
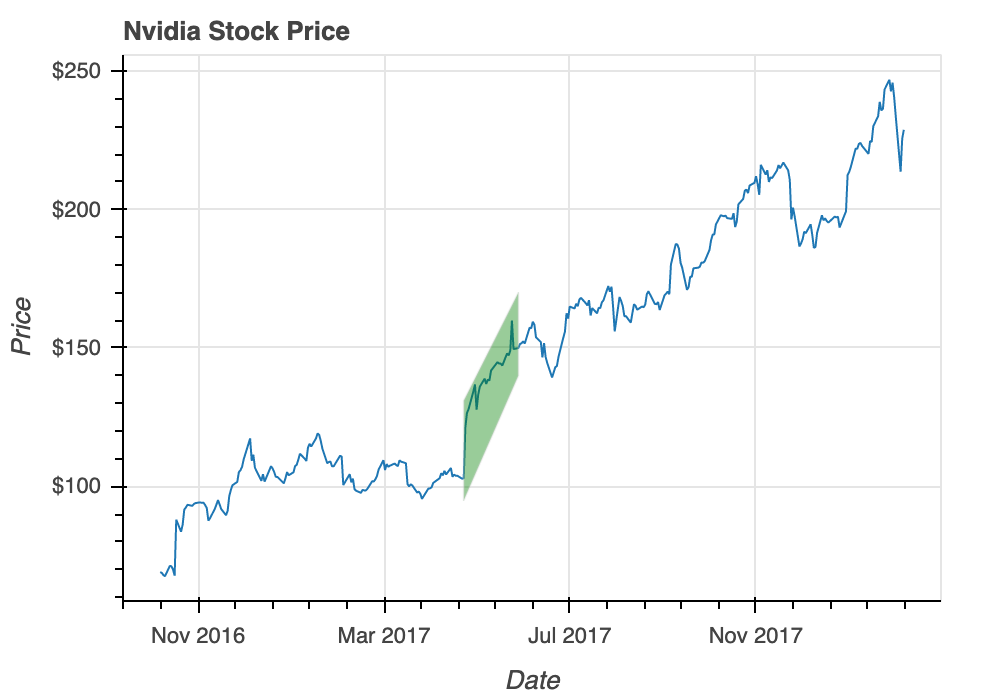
fig = figure(title="Nvidia Stock Price", x_axis_label="Date", y_axis_label="Price")
fig.line(x="date", y="close", source=source)
fig.xaxis[0].formatter = DatetimeTickFormatter(months="%b %Y")
fig.yaxis[0].formatter = NumeralTickFormatter(format="$0")

start_date = dt.datetime(2017, 5, 9)
end_date = dt.datetime(2017, 6, 12)

start_float = start_date.timestamp() * 1000
end_float = end_date.timestamp() * 1000

start_data = nvidia.loc[nvidia['date'] == start_date]['close'].values[0]
end_data = nvidia.loc[nvidia['date'] == end_date]['close'].values[0]

polygon = PolyAnnotation(fill_color="green", fill_alpha=0.4,

                         xs = [start_float, start_float, end_float, end_float],

                         ys = [start_data-8, start_data+28, end_data+20, end_data-10])

fig.add_layout(polygon)
output_file(filename="nvidia_polygon_annotation.html")
show(fig)