LassoSelectTool 추가
Bokeh로 배우는 인터랙티브 데이터 시각화

George Boorman
Core Curriculum Manager, DataCamp
검사 도구(Inspectors)
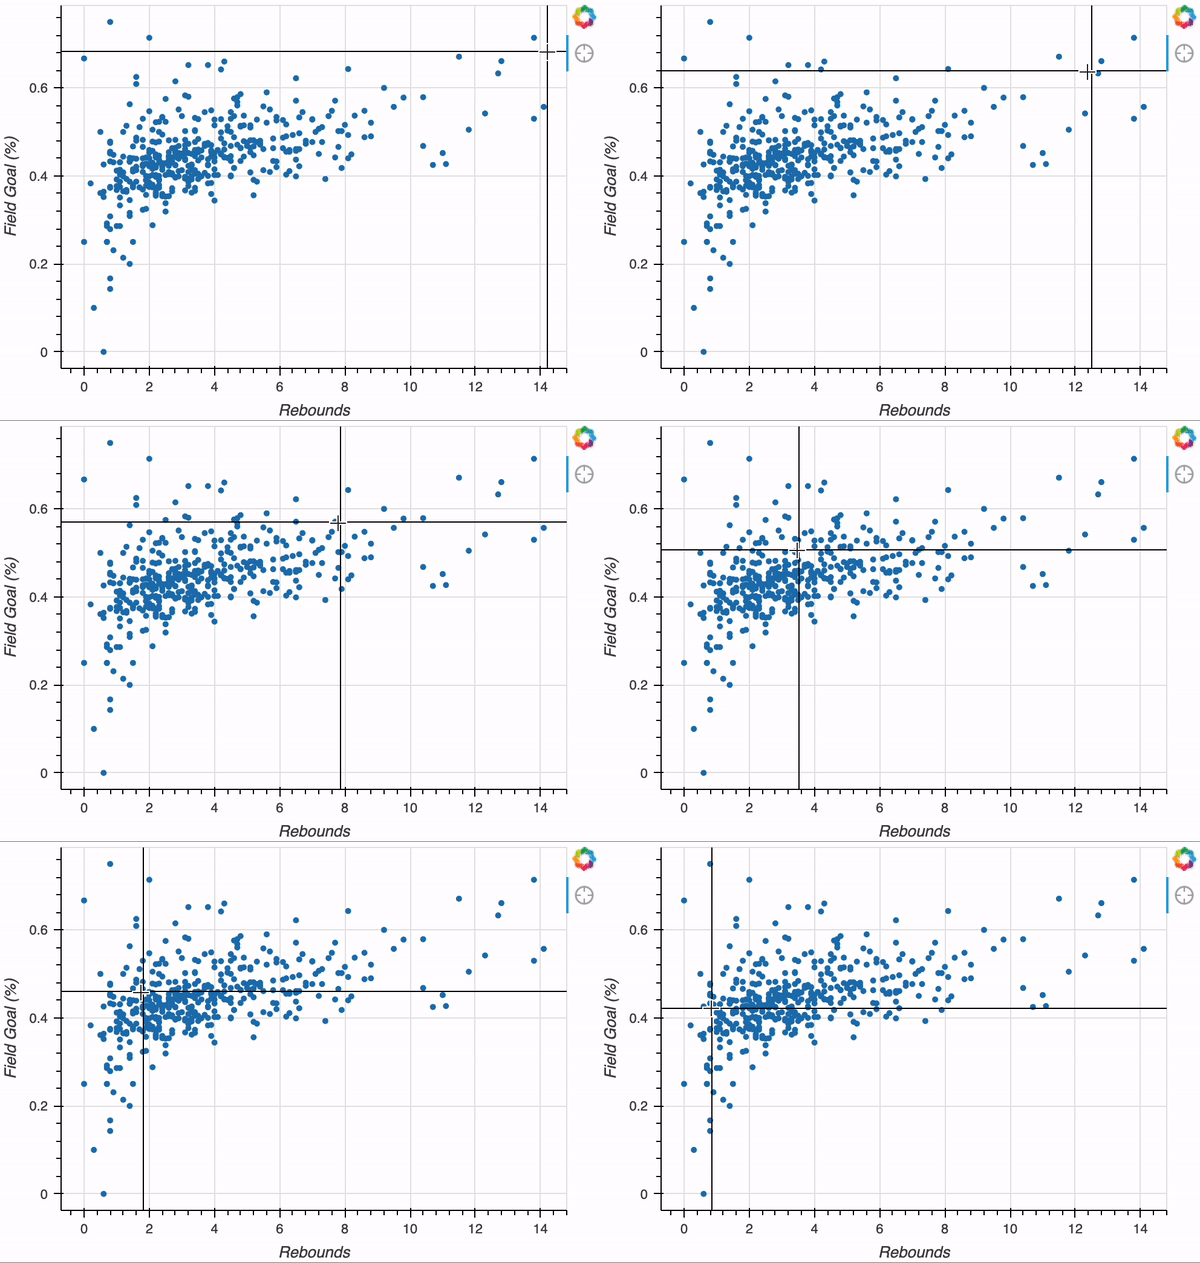
- CrosshairTool
crosshair
- HoverTool
hover
1 https://docs.bokeh.org/en/latest/docs/user_guide/tools.html#userguide-tools-inspectors
Bokeh 데이터 소스 객체
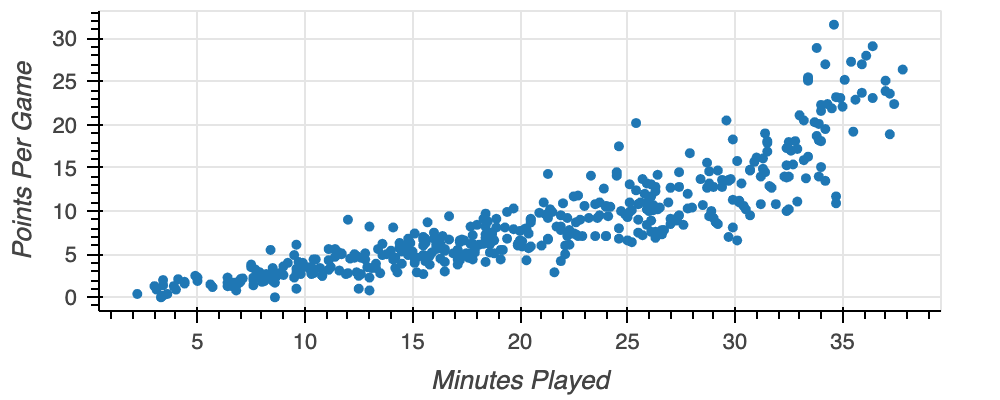
from bokeh.models import ColumnDataSourcesource = ColumnDataSource(data=nba)fig = figure(x_axis_label="Minutes Played", y_axis_label="Points Per Game")fig.circle(x="assists", y="points", source=source)output_file(filename="ColumnDataSource.html") show(fig)
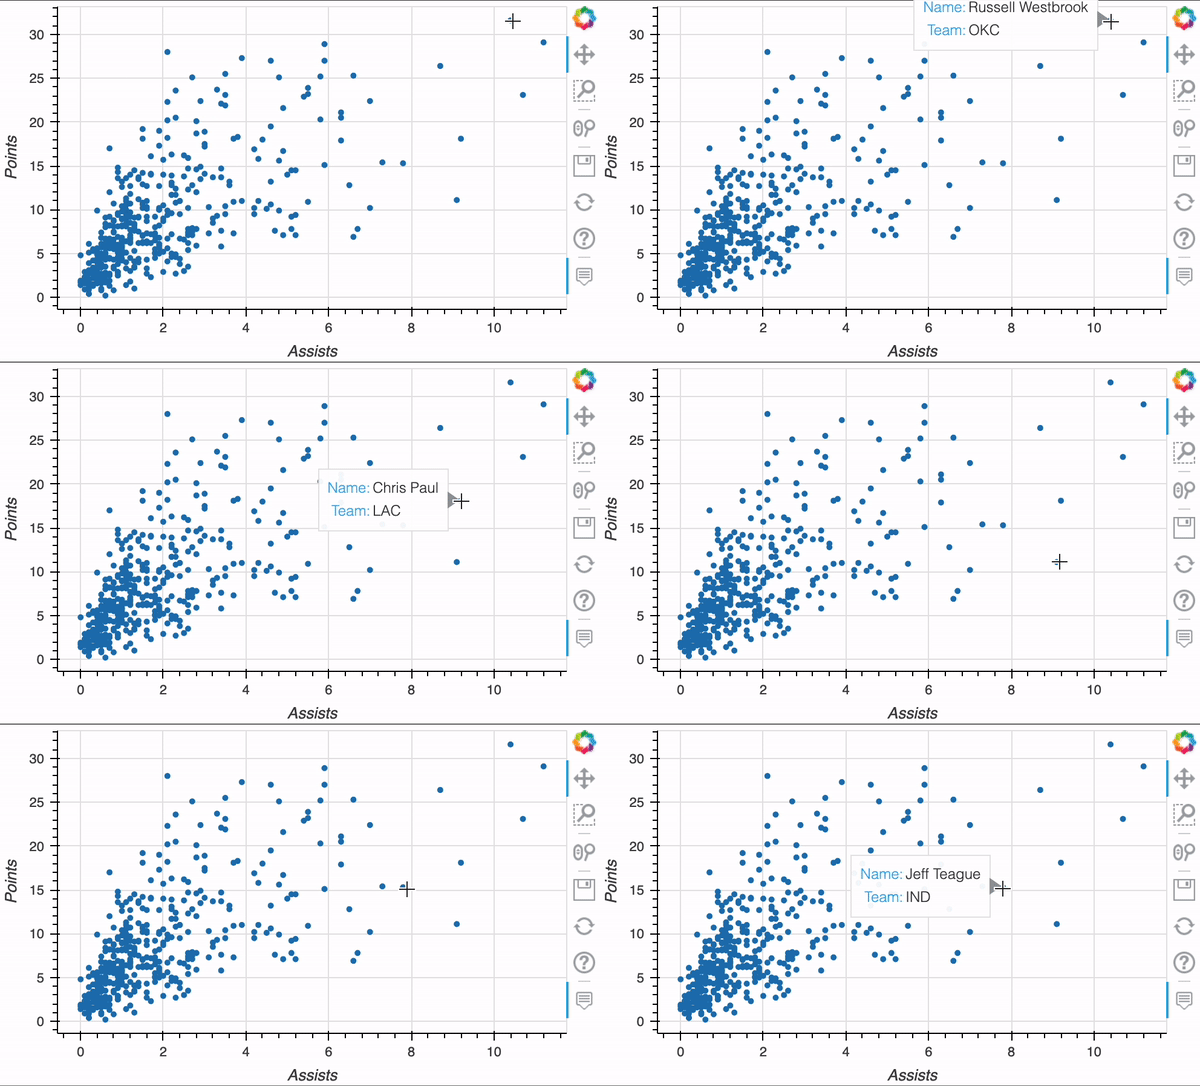
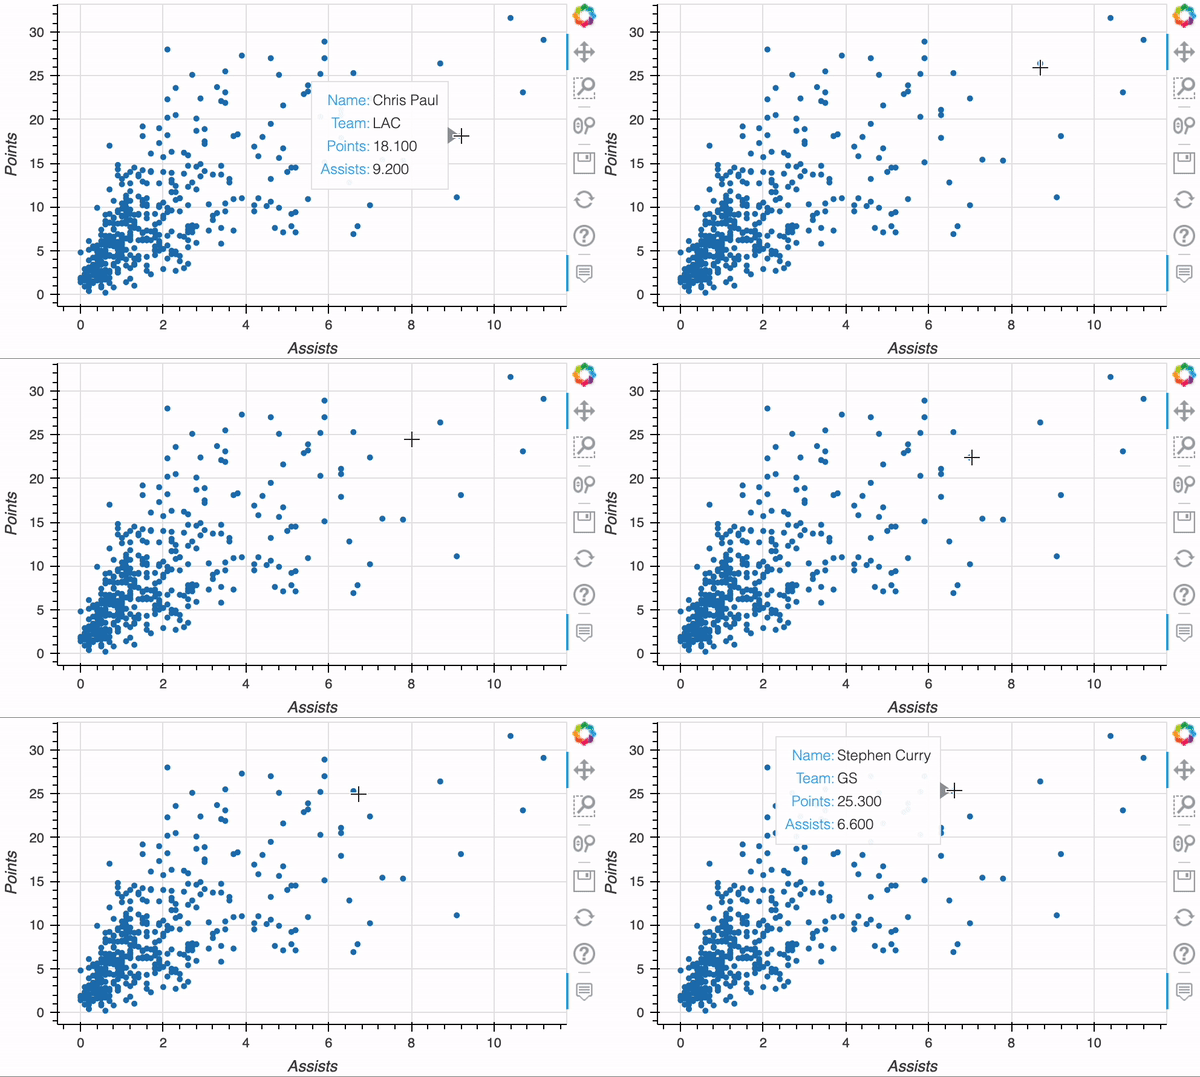
실행 중인 HoverTool
숫자 데이터 표시
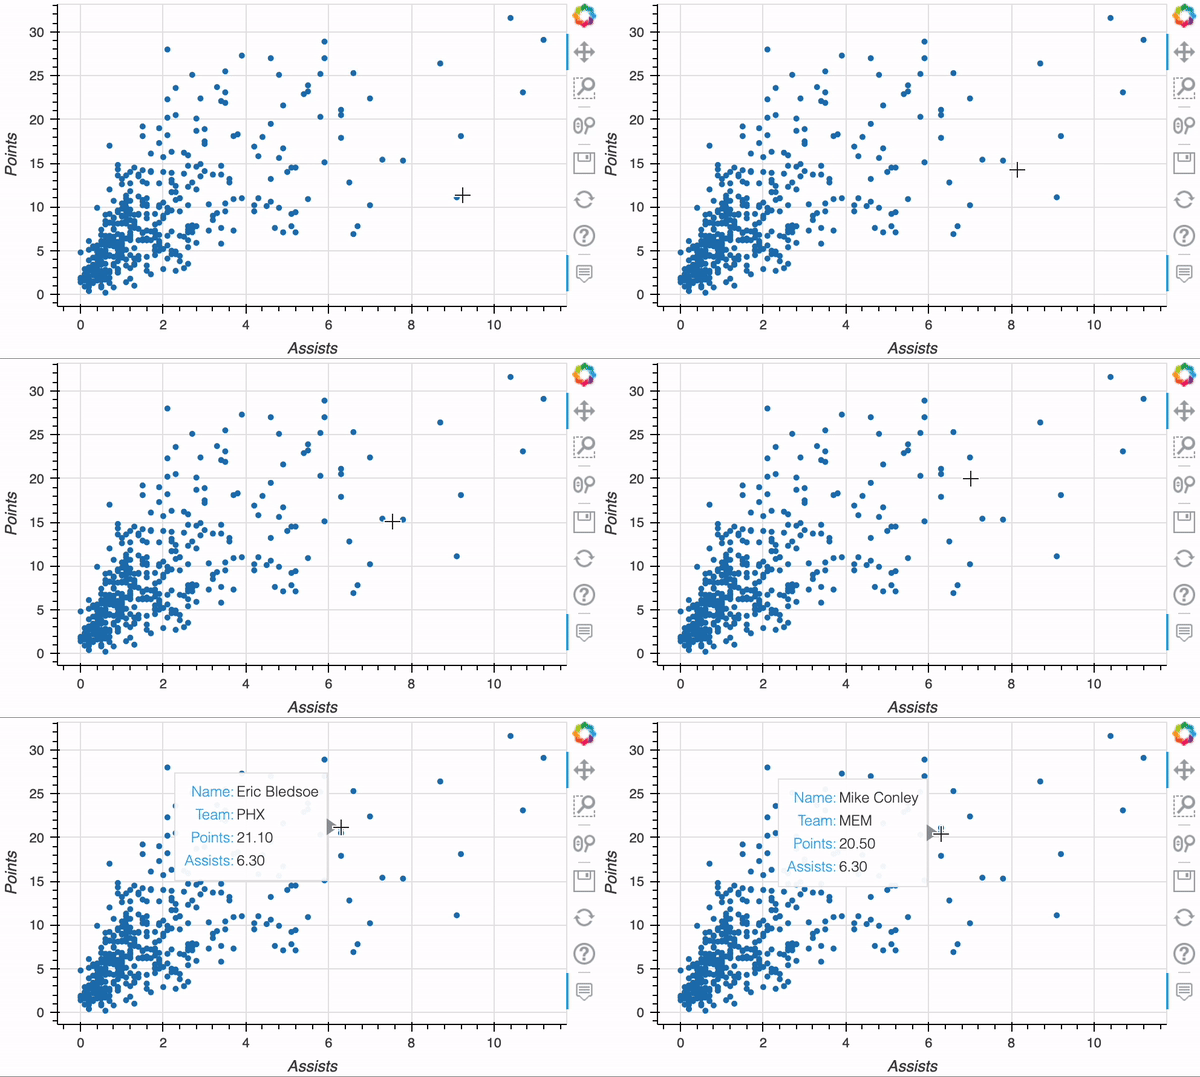
TOOLTIPS = [("Name", "@player"), ("Team", "@team"),("Points", "@points"), ("Assists", "@assists")]fig = figure(x_axis_label="Assists", y_axis_label="Points", tooltips=TOOLTIPS) fig.circle(x="assists", y="points", source=source) output_file("hovertool.html") show(fig)
HoverTool 서식 지정
TOOLTIPS = [("Name", "@player"), ("Team", "@team"),("Points", "@points{0.2f}"), ("Assists", "@assists{0.2f}")]fig = figure(x_axis_label="Assists", y_axis_label="Points", tooltips=TOOLTIPS) fig.circle(x="assists", y="points", source=source) output_file("formatted_hovertool.html") show(fig)