소개 및 동기
R로 배우는 사기 탐지

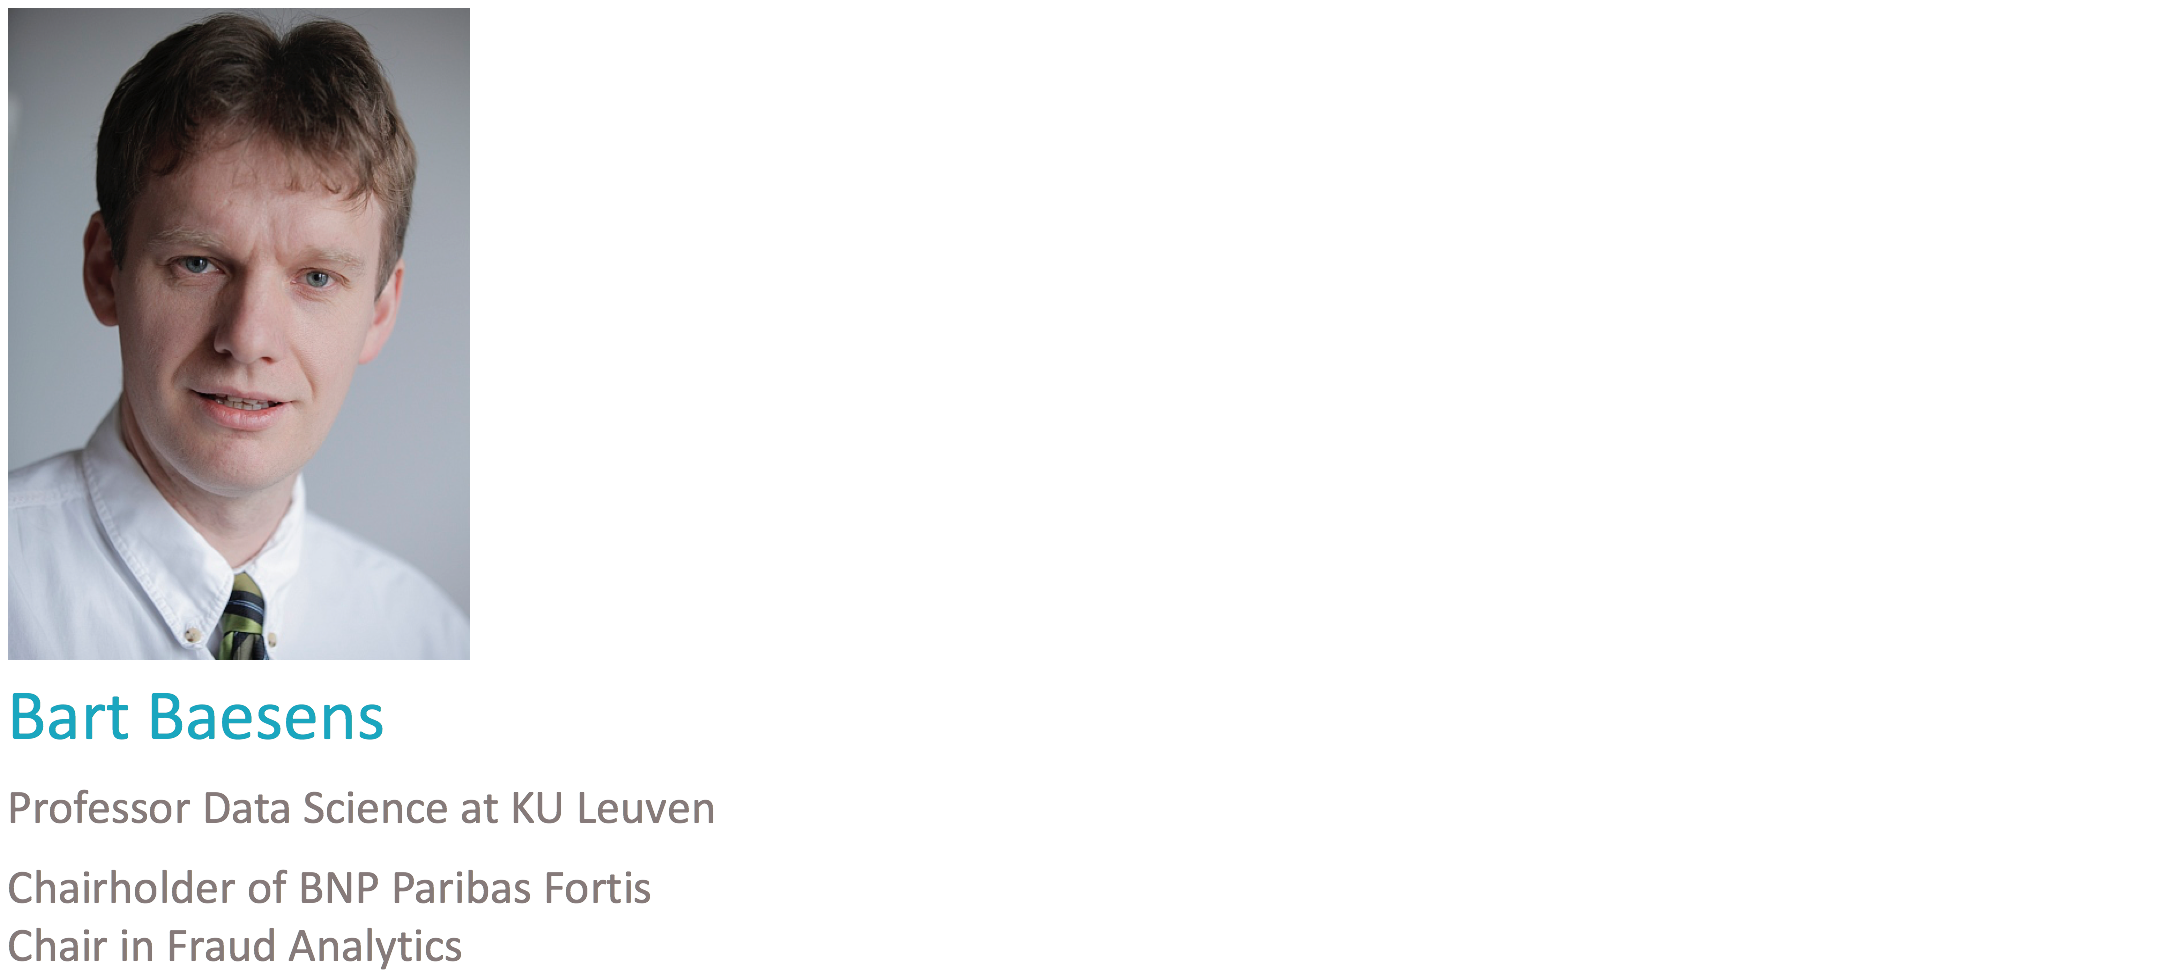
Bart Baesens
Professor Data Science at KU Leuven
강사 소개
강사 소개
강사 소개
사기란 무엇인가?
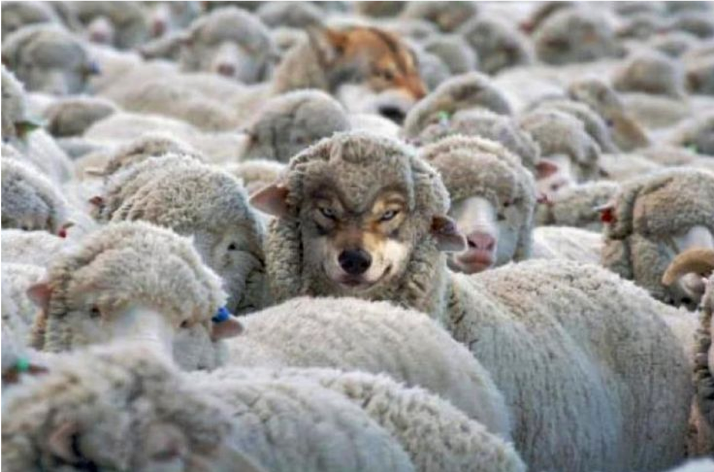
사기는 드물고, 의도적이며, 교묘하게 은폐되고, 시간에 따라 진화하며, 종종 치밀하게 조직화된 범죄로 다양한 형태로 나타납니다.
성공적인 사기 분석 모델의 주요 특성

성공적인 사기 분석 모델의 주요 특성

성공적인 사기 분석 모델의 주요 특성

성공적인 사기 분석 모델의 주요 특성

성공적인 사기 분석 모델의 주요 특성

사기 탐지 모델의 과제

사기 탐지 모델의 과제

사기 탐지 모델의 과제

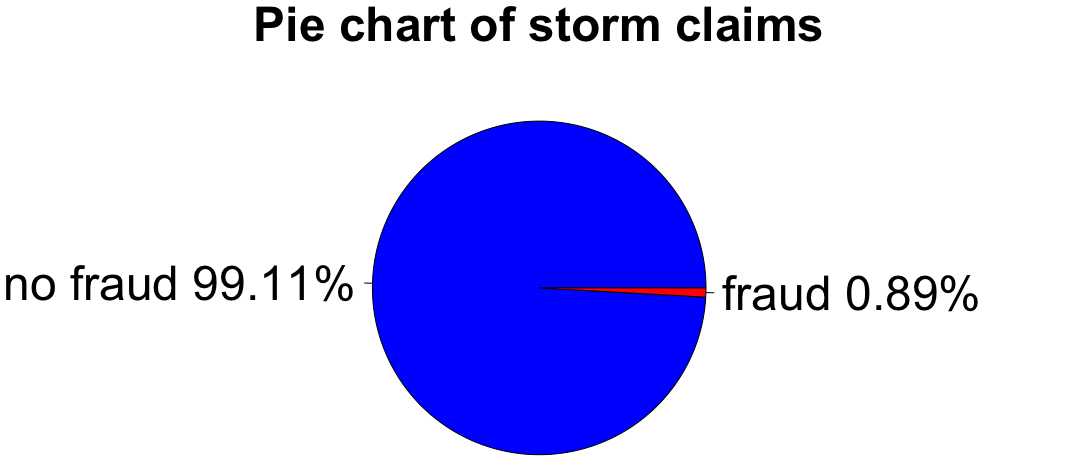
파이 차트로 불균형 시각화
labels <- c("no fraud", "fraud")
labels <- paste(labels, round(100 * prop.table(table(fraud_label)), 2), "%")
pie(table(fraud_label), labels, col = c("blue", "red"),
      main = "Pie chart of storm claims")
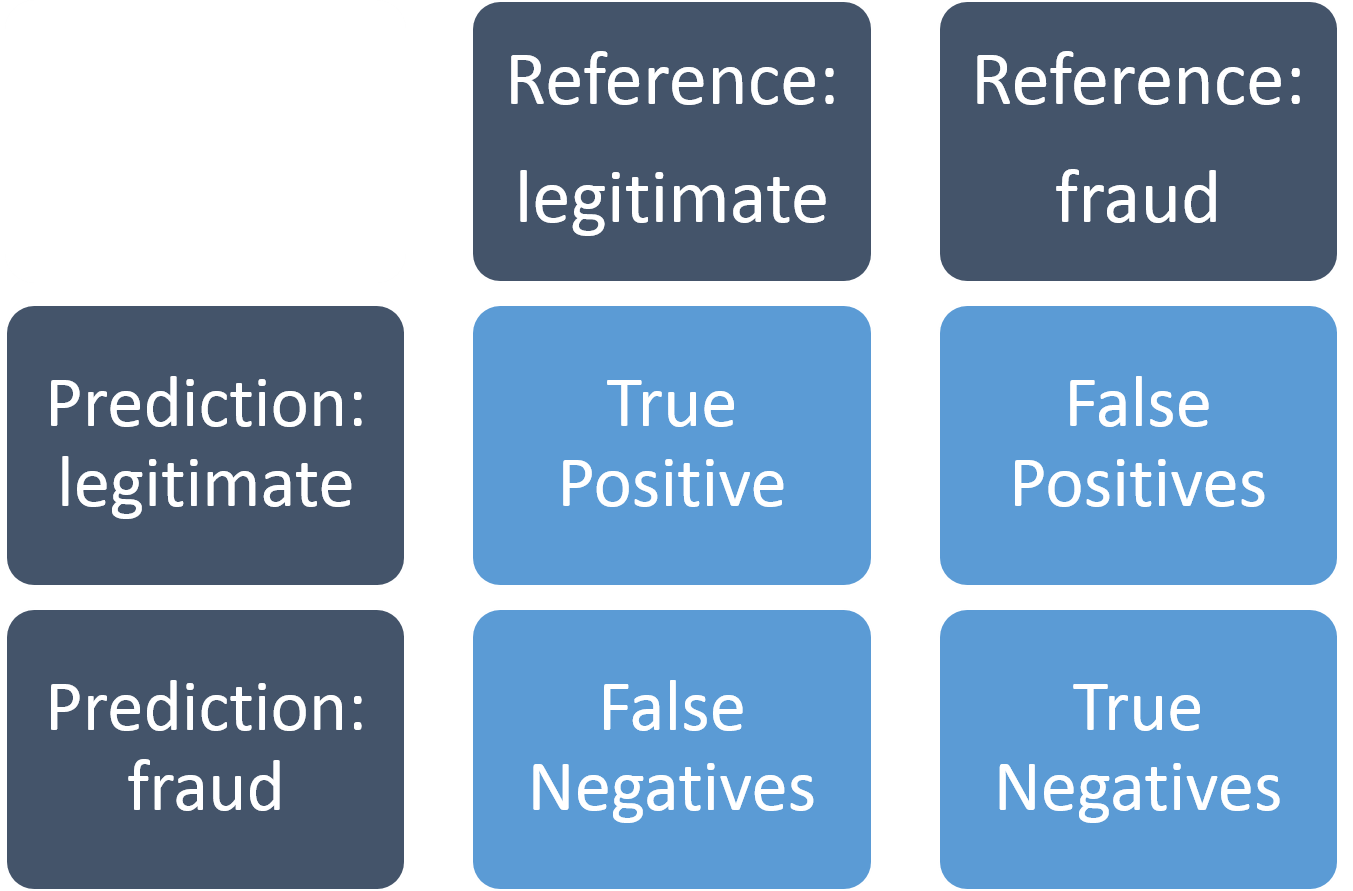
혼동 행렬
사기 탐지 모델 평가에 사용: